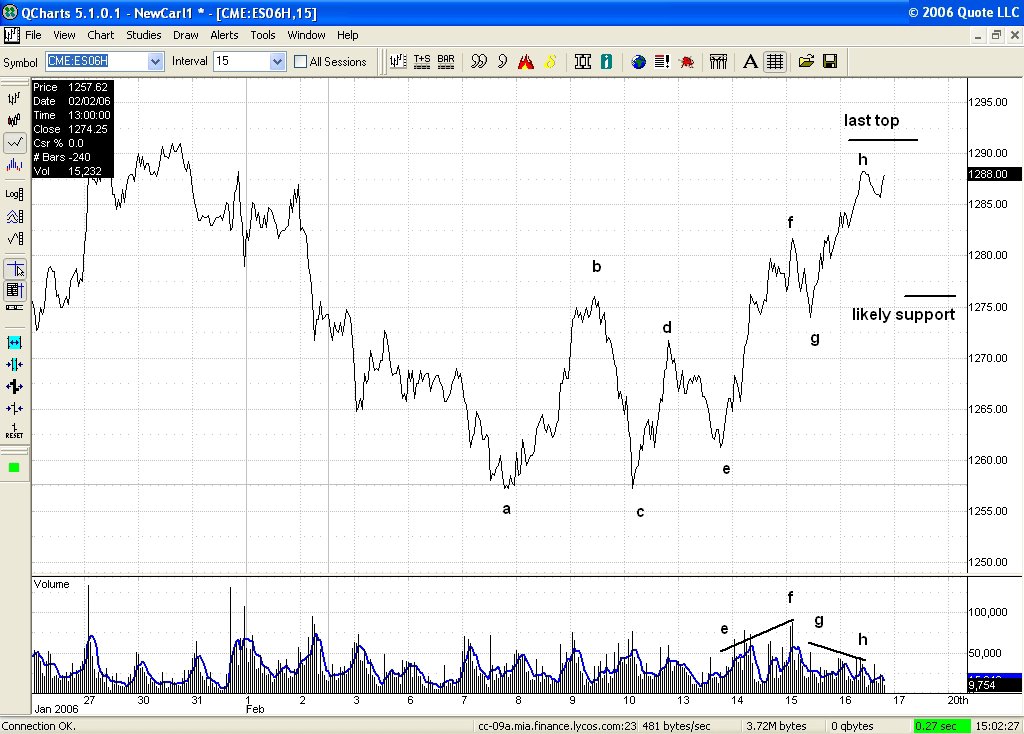
Here is a line chart of prices at 15 minute intervals in the March E-mini S&P futures.
It looks to me like the market is about to start a reaction of 12 points or so. Here is my reasoning.
First the market has approached the previous high at 1291.75 of January 30 which was followed by a 35 point break. So traders naturally key on such points as opportunities to take the opposite side of the current trend, at least if there are other reasons for fading it too.
In this instance I think there are indeed reasons to suspect that we will see a break of a day or two. Notice how the upswings are growing shorter: g to h has been shorter than e to f and the point h was about 7 points higher than f while f was about 10 points higher than d.
Of equal significance is the fact that the volume of trading showed a marked tendency to decrease on the advance from g to h in contrast to its tendency to rise on the previous advance from e to f.
So at this juncture I would expect a break comparable to d to e which was about 13 points.
No comments:
Post a Comment