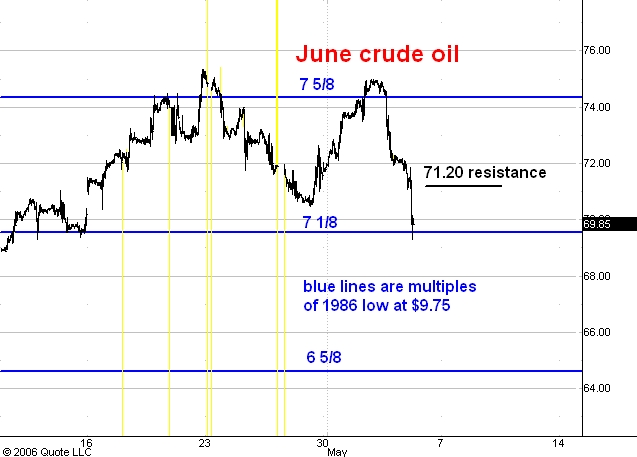
Here is a highly condensed hourly chart showing pit and electronic trading in June crude oil futures. I last commented on this chart here.
Crude has put in a lower top and a lower low. Moreover, the break to a lower low was a high volume drop as is evidenced by the wide ranges and high velocity of the breakout move.
I think this means that crude has started a drop to 50.00. If this breakout is genuine then I don't think the market will trade above the 71.20 level which I have marked as resistance on the chart.
No comments:
Post a Comment