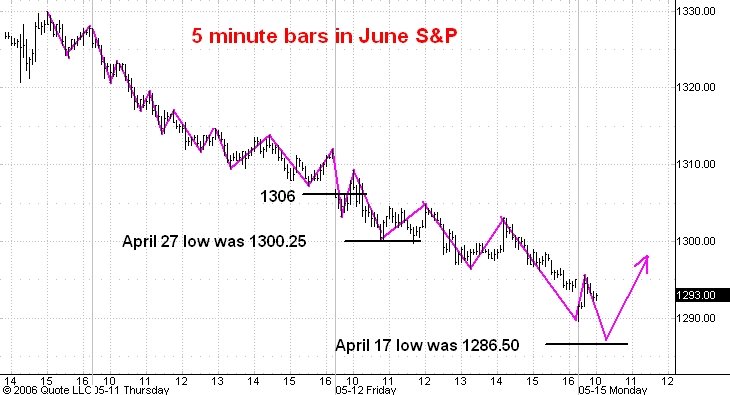
Here is a 5 minute bar chart showing regular hours trading in the June S&P e-mini futures. I last commented on this chart Friday.
You can see that the market has dropped in an amazingly long series of lower lows and lower highs. After such a long, regular decline the first break above a previous reaction high generally means that a new trend in the opposite direction has started. This is what I expect to happen today.
Overnight the market dropped as low as 1285.25. After the open it rallied as high as 1295.50. I think we will see another drop to 1285 or so and then a rally above 1296 today.
The subsequent move up should carry into the 1310-15 zone and will constitute the second phase of a three phase drop from 1331.25. I expect the third phase to carry from 1310-15 down to 1265 or so. After the third phase low I think the market will move up to 1350 or even higher.