Here is a daily chart of December gold futures. I last commented on this market here.
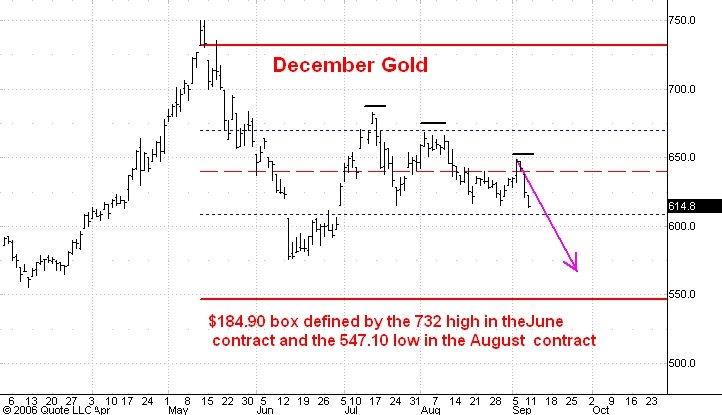
On this chart I have drawn the box which is defined by the May-June break in gold futures. The top was at 732 in the June contract and the low was at 547.10 in the August contract, giving a box size of 184.90.
The market has been oscillating roughly between the 1/3 and the 2/3 division points of this box (blue dotted lines). The break during the past two days has convince me that we have seen three consecutive lower tops in gold (black lines). This is a very bearish indication and makes me think that the market is now headed below the 500 level.
The 1/2 division point of the next lower box is at 455 and I think this is a reasonable target for this drop.
No comments:
Post a Comment