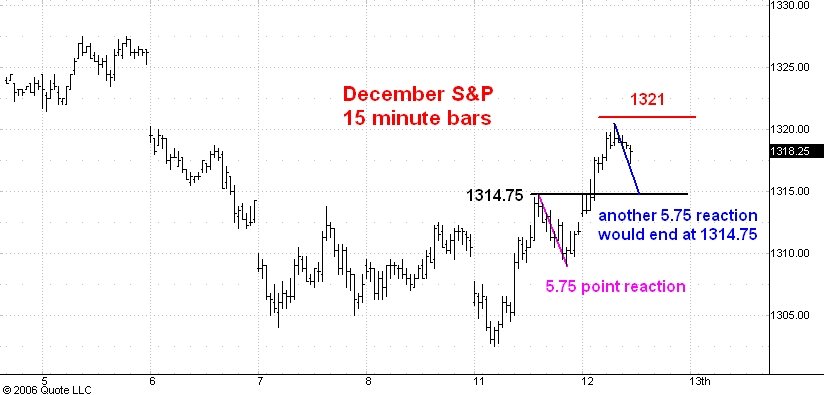
Here is a 15 minute bar chart of the December S&P futures.
In my post earlier this morning I said that should the market hit the 1321 level I would conclude that the reaction ended at 1302.50 and that the short term trend would now be upward. I have since been mulling over the significance of the fact that that the S&P's moved a full 5.50 points above what should have been ideal resistance at 1315 and did so in a decisive fashion.
The first observation I want to make is that another break equal to yesterday afternoon's drop of 5.75 points would put the market right at its 1314.75 high, an obvious support point. This suggests that indeed the trend may well have already turned upward.
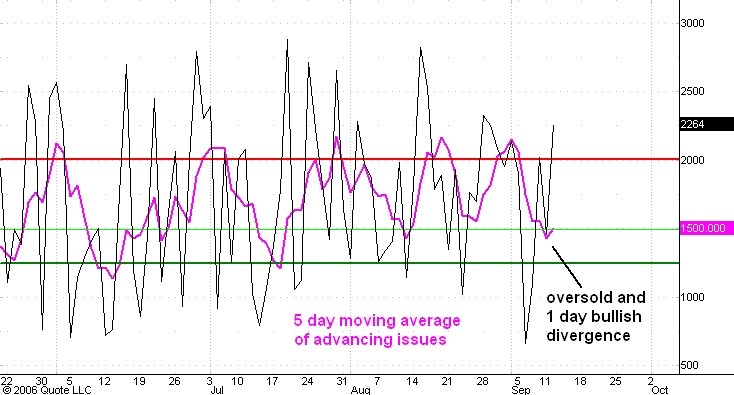
The second observation concerns the daily count of the number of advancing issues on the New York Stock Exchange. This is the second chart above this post. The daily count is the black line and the 5 day moving average is the pink line.
Notice that yesterday's reaction low occurred together with a higher low in the daily count of the number of advancing issues. This is a minor bullish divergence. Note also that this minor divergence occurred with the 5 day moving average in an "oversold postion" and below its last low. These facts are further evidence that yesterday's low at 1302.50 ended the drop from 1327.
Since I am generally bullish on the S&P the above considerations have convinced me that the 1302.50 low will hold. In fact I doubt that the reaction from this morning's high at 1320.50 will go even as far as 1315.00. I think the next stop will be the 1330 level and this should only be temporary resistance.
No comments:
Post a Comment