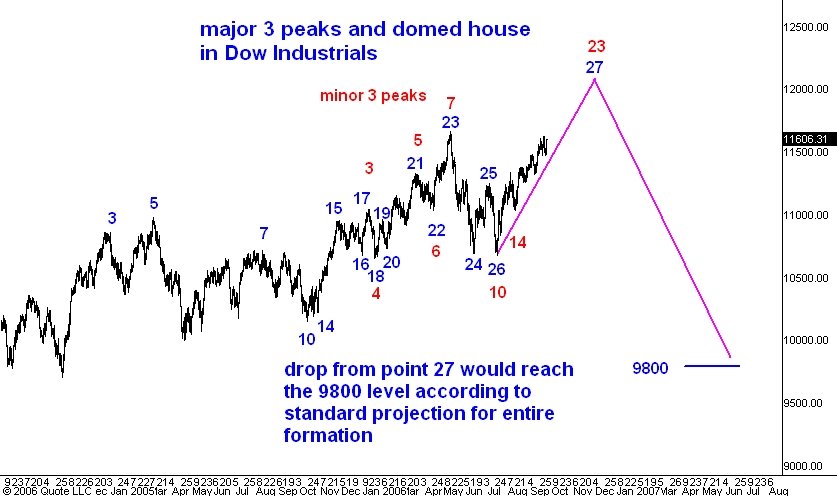
Here is a highly condensed daily bar chart of the Dow Industrial average. On it I have marked the turning points of a pair of George Lindsay's three peaks and a domed house formations which I have been following. Here is my last post on the subject. You can read my posts on this ongoing formation by following this link to all of my George Lindsay posts.
For the past several months I have been saying that we are well along in the major formation which is labeled by the blue numbers at its turning points. Right now I think we are in a rally to point 27. Normally point 27 will not exceed point 23 but in the current situation there is a complicating consideration.
There is also an easily identified minor three peaks which I have labeled in red. This minor formation has not yet established point 23, the top of the domed house. Point 23 is generally the highest point of the formation and this is what led me to think that blue point 27 (which will coincide with red point 23) will be above blue point 23.
For reasons I have discussed previously I think that blue point 27 and red point 23 will probably develop in late November of this year a bit above the 12000 level in the Dow. Upon completion of point 27 Lindsay's theory says that the market should fall to the start of the entire major (blue) formation. This in my estimation is the 9800 level in the Dow.
No comments:
Post a Comment