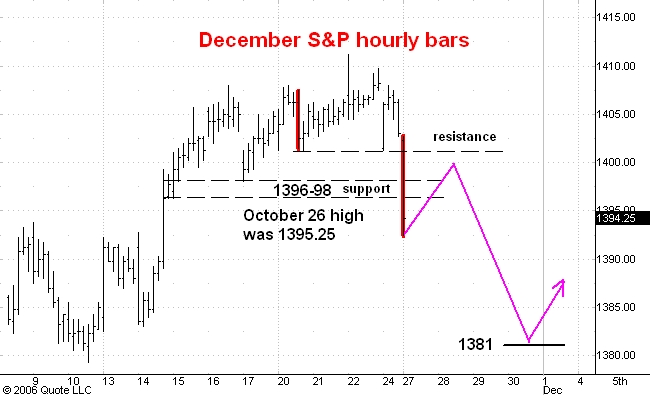
Here is an hourly chart of the December S&P e-mini futures. I last commented on this market here.
In this morning's guesstimate I said that the market was headed down into the 1396-98 support zone. But instead of stopping there as I had expected the S&P's continued lower to 1392.50 (so far). Not only was support broken by a visible amount, but it was broken while the market was putting in a wide range down bar.
This behavior tells me that a 30 point break has begun. A correction this big would equal the length of the last signficant drop from the October 26 top at 1395.25 to the November 3 low at 1365.50.
Meantime I think the market will rally about as much as it did from Friday's electronic low at 1400, i.e. about 8 points. This would bring the S&P's up to 1400 or so, below resistance which I think stands in the 1400-01 zone. After this rally the third phase of the correction should carry the market down to 1381.
I still think we shall see a rally at least to the 1418-20 resistance zone by the end of the year.
2 comments:
Thank you for your analysis.
I am curious, however, as to why you think the US dollar's downside is limited. It's just my humble chart interpretation, but it looks to me like the dollar could move much lower still.
Thanks
carl in your lindsay posts, you had mid-latter november as the big dome/count middle section top. has the analysis changed away from this november area? thanks
paragraphs with analysis...
"To project point JJ I again start from point E but this time count forward to the alternative ending point of the basic decline from point J. This is point AAA on April 20, 2005. The time from E to AAA is 579 calenday days. Counting 579 days forward from AAA gives a projected top at point JJ on November 20, 2006.
This November 20 forcast should be compared with the November 27 forecast derived from the minor three peaks and a domed house formation, the November 18 and 29 dates derived from the theory of basic advances and basic declines , and with the November 17 and November 21 dates derived from mirror image calculations. All of these puzzle pieces fit together. It seems very likely that an important top in the Dow will occur during the second half of November 2006."
http://carlfutia.blogspot.com/2006/10/lindsays-theory-of-middle-sections.html
Post a Comment