Here is a pair of point and figure charts of the Oil Service HOLDRS etf. I last commented on OIH here.
The first chart is a 3 box reversal chart of OIH going back to its all time high at 169.75. Remember that the data used by StockCharts.com is adjusted for divident payouts so on this chart the recorded high is about a point lower than the actual print high at the time.
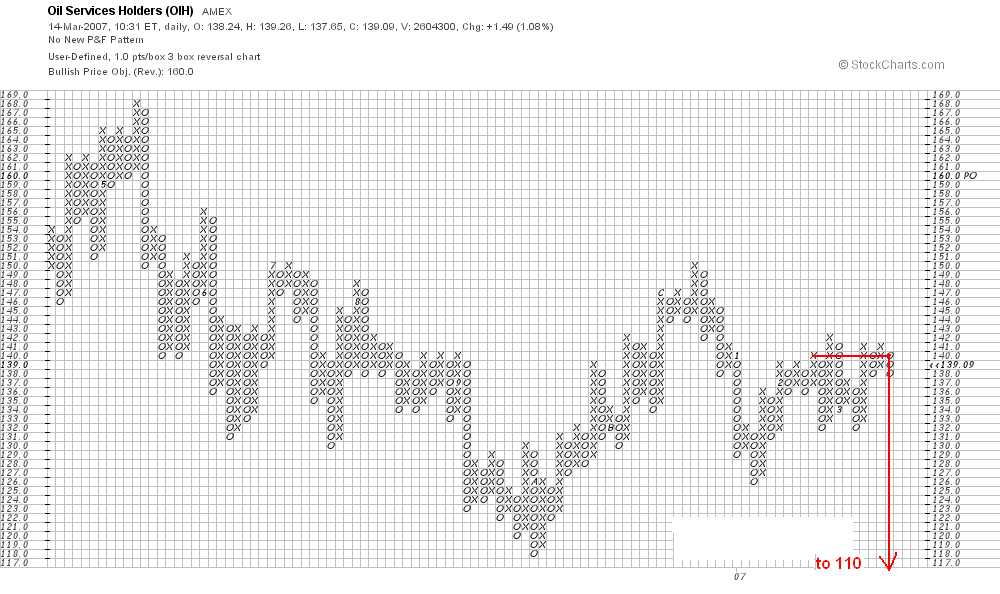
On this chart I want to bring your attention to the price action since the October '06 low at 118 and change last year. Near this low you see a congestion area (a period of sideways movement) which extended about 12 columns across the 123 price line. Around the December high at 150 on this chart the corresponding congestion area extende 8 columns across the 145 line, as as such was a smaller congestion area than the one near the 118 low. This is usually evidence that the break from the congestion area near the top will not break below the low congestion area.
On the same chart look now at the action from the January low at 126 to the recent high at 142. Notice how small the congestion area near the 126 low is in comparison to the one near the 142 high. This is a sign of distribution and a warning that the 126 low will be taken out on any break from current levels. There are 10 columns across the 140 line in the higher recent congestion area. Since this is a 3 box reversal chart, we multiply 10 by 3 and expect any drop from here to carry down 30 points from 140, i.e. to 110. The significance of this count is that it calls for a resumption of the bear market.
Now look at the second chart above this post. This is a one box reversal chart. It records in detail the activity since the January low at 126. The congestion area near the recent top is much bigger than the one near the 126 low on this chart and this emphasizes the message of the 3 box reversal chart. The count on the 1 box reversal chart projects a drop to 114.
The 1 box reversal chart contains a bit more information that is important. Note the recent test of the high near 142 resulted in a very narrow range of trading extending 9 columns across the 139 line. This narrow range developed near the high of the 132-142 congestion area and as such indicates distribution. It counts down to the 130 level which indicates an imminent downside break from this congestion area.
All in all these two charts are sending a bearish message. I think OIH is about to begin a move to 110 or lower.
No comments:
Post a Comment