

Here are hourly charts of the S&P's, the Spiders, and the QQQQ's. I last commented on these markets here.
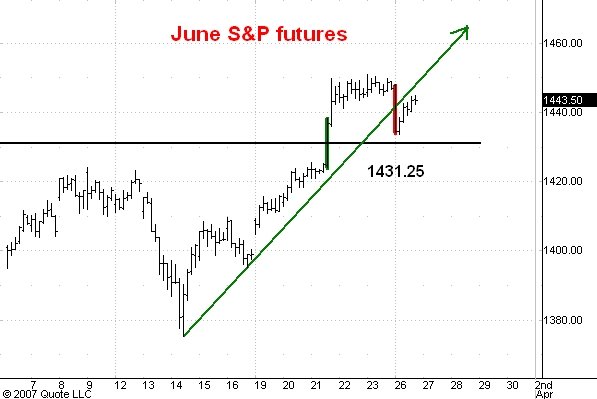
The markets dropped this morning after the housing starts number but held above the breakout level in all three cases. This is bullish action. It is empahsized by the fact that the wide range down bar which developed in response to the news was followed by little subsequent selling. This means that longer time frame traders were buying on bad news and this is also a bullish indication.
I think that these breakout levels are now support and that the next significant development will be a move in the futures to 1463, the Spiders to 145.00 and the Q's to 45.60.
New bull market highs will be seen by all three markets during the next couple of months.
2 comments:
Carl,
With the Russel 2000 bumping up against the underside of its former trendline and not breaking through, isn't possible that we're about to see the third phase of the correction that you were looking for before the Fed meeting? Which, would put the ES down by 1360 ... like you were expecting before?
Thanks for continuing to publish your work.
well said.
is it possible a hangman?
Post a Comment