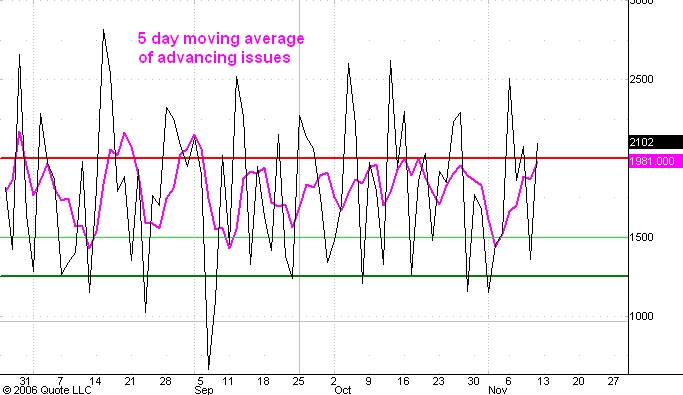
Here is a line chart showing the daily count of the number of issues traded on the New York Stock Exchange that advance in price (black line) and the 5 day moving average of that number (purple line). I last commented on this indicator here.
You will notice that today's count is relatively high and also higher than yesterday's. This despite the fact that the S&P 500 cash is up a little more than a point and the Dow Industrials are actually down 2 points.
This is a very bullish "divergence" in my opinion. It strengthens my conviction that the market is still strong and destined to move above the 1400 level soon.
dear sir
ReplyDeletei wish to thank you for you work
but today i also wish to respectfully argue a few points .
if the linsay time spans were based on the spx would you move you timeframe forward 60 days roughly to include mid to late feb 2007 for a top ?? assuming the nov 20th date turns into a bottom .
also i think if lindsay was alive over the past 20 yrs he would also have recognised the larger 3 peaks domed house with in larger time spans . what im bring to this is
what if the dow holds up into feb 7th 2007 then declines and holds above 10700 next yr ( your smaller
point 10 ) ???? i say this because i am a pattern trader yet i use larger patterns with in patterns
and i think you might ( only might )be overlooking the larger 3 peaks domed house pattern that began in 1997 . so a 10 year time frame versus a lindsay 5 yr time frame ( regarding mid section )
point 10 is 7197 when looking at this ( i realise not textbook by lindsay's work with this pattern )
but it is a text book 3 peaks domed house pattern both monthly and weekly . and it fits what your saying ( yet your showing pt 27 as the top ) that is why i think your over looking the larger pattern becasue you work is all text book lindsay . ill be honest i like that you dont alter lindsay's work to fit . but i still think your missing the larger pattern . and while i realise it means altering
what your work shows . it is in my opinion what is going on . i would not be suprised to see your nov 21-29 time frame as a low in the stock market which is followed by a top into january or febuary 2007 .
and also would not be suprised to
see a point 22 low near 11,000 on the weekly 3 peaks domed house pattern . ( monthly were in point 23 from june 2006 lows .
what we have is an entire new set of parameters regrading time spans
with in the 3 peaks domed house
pattern ( something lindsays was
not alive to see or write about )
so you will come to terms with your smaller count next yr if the dow fails to get below 10700
just something to think of is all
like i stated above just a respectful arguement i wish to make . overall i think you do good work and while i think you get
a it scattered from time to time regarding the short term flucuations overall i have to say
you get it right more then wrong .
my email is fiborules@yahoo.com
if you wish to dig into what im saying more in depth regarding the
weekly and monthly pattern im talking about . i have been following for far to long to change it .