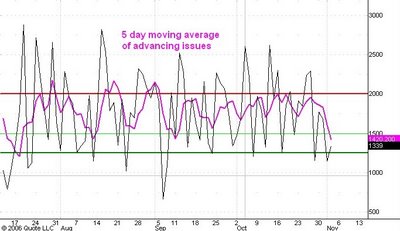
Here is a line chart of the number of issues traded on the New York Stock Exchange that advance in price each day (black line). I last commented on this indicator here. Remember that the trading day has another 5 hours to go so the last data point on this chart only tells us the current situation in the market, not the situation at the end of today.
Notice that the 5 day moving average of this number (purple line) has dropped below the light green horizontal line indicating a moderately oversold condition. The black line so far is higher than it was yesterday and I expect that it will also be higher at the end of trading today. If so then we will have a minor bullish divergence in the daily number against a backdrop of a moderately oversold condition in the 5 day moving average. This is the typical situation at the end of a 3 to 5 day reaction such as the one we have seen from the 1395.25 level.
I take this as preliminary evidence supporting my view that the market's next swing will be upward into the 1410-20 zone.
No comments:
Post a Comment