The mood of investors and traders in the US stock market continues to grow gloomier and this means that a speculator has got to ask himself whether there is a good buying opportunity at hand.
I do this by checking the market's position against my box theory calculations. If it appears to be near the bottom of some longer term boxes, then this coupled with the bearish sentiment we see means that it is a buy.
The S&P has been trending higher since October 2002 in boxes that have been about 186 points in height. The first box extended from the 768 low to 954, the second from 954 to 1140, the third from 1140 to a projected box top at 1326 (which I think is likely to be the bull market top later this year). The main thing to notice is that in March the market bounced off of the 1/2 point of this last box at 1233 and has now come down to the bottom of the box at 1140.
This is a very low risk buying opportunity in light of the very bearish market sentiment I think I am seeing.
Thursday, April 28, 2005
Wednesday, April 27, 2005


A long term look at crude oil
The chart above depicts my long term box analysis of West Texas crude oil.
There is a clearly delineated, long term box that is $30 high with bottom of the box at $10 and top of the box at $40. This past year prices broke decisively above the top of the box. Generally speaking, the next stopping point after a breakout is half the box size (in this case half of $30 is $15) above the top of the old box, i.e. $55. The market nearly reached $57 and in my view is now headed back down to the bottom of another $30 box which I estimate is at $25.
One reason (among others!) I have confidence being a long term bear here is that expectations of $60 crude and even of $100 crude are widely held. Few people expect crude to drop even below $50. In fact, $50 is now regarded as a permanently high plateau for crude oil.
Tuesday, April 26, 2005
Bond boxes
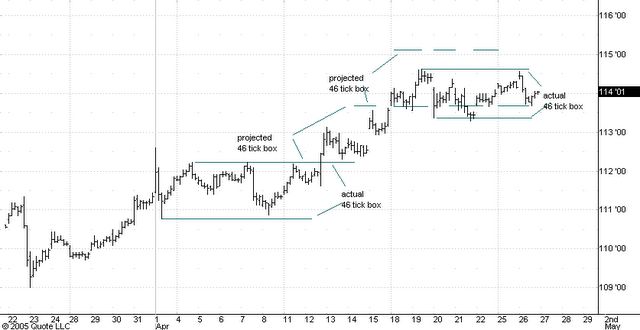
Just above this post you should see an hourly bar chart of the June '5 treasury bond futures. I've drawn some lines on this chart to illustrate what in my view is the most basic and useful type of technical analysis - Nicolas Darvas' "Box Theory". This is the only sort of technical analysis I think you will ever need.
Darvas described the box theory as his own invention in his 1961 book "How I made 2 million dollars in the stock market" (Its a fun read and I strongly recomend it). While Darvas may have indeed come up with the box theory on his own, the basic principles have been known to good traders for as long as there have been speculative markets because they neatly fit the observed behavior of all markets.
Will studying the box theory make you a good trader? Probably not, because successful trading requires certain artistic skills and a certain emotional makeup that most people don't have. But if you are one of the few who are cut out for the speculative game, you will find the box theory very useful tool.
Darvas failed to explain his box theory clearly in his books. In this blog I hope to communicate the basic principles of the box theory by illustrating them with some real time examples.
Boxes are often referred to as trading ranges but I prefer the term "box" out of deference to Darvas and also because of its snappy pronunciation. The basic principles of the box theory are easy to state. First, the size of boxes tends to change only slowly. Secondly, boxes of the same size tend to stack on top of one another very neatly. Finally, boxes show the trend direction: an uptrend will show a series of boxes at higher and higher levels and a downtrend will show the reverse.
The weekly trend in the bonds turned up from the 109 low on March 23. Although I have not shown it on the chart, the 109 level was easily projected as a box low using the boxes that had developed in the downtrend from the 117 top in February 2005. The start of the uptrend was then shown when the market broke above the 110-12 level which was the projected top of the last box in the downtrend and the actual low of the second-to-last box in the downtrend.
The first multi-day box in the new bond uptrend developed during the first two weeks of April. At this point I must empasize that delinating and/or estimating the location of the top or bottom of a box requires a certain artistic skill. I am convinced this skill can be acquired through constant practice and I am also convinced that this is the ONLY way to do it!
In any event, the two horizontal solid lines delineate an actual box that is 46 ticks wide. When your think the trend is up you must be a buyer near the lower edge of any box. That bottom edge may have already been formed by a previous price extreme or its location may only be an educated guess made by assuming the new box will be the same size as the preceeding box.
In this case the intial 6 hour rally off of 109 was 46 ticks, so estimating a 46 tick drop from the employment number high of 112-19 would have made you buy near 111-05; the low that same day was 110-25. Note also that the subsequent rally off of 110-25 was exactly 46 ticks! I would then be inclined to say that the box extended from 110-25 on the low side to 112-07 on the high side. The trading that occurred previously between 112-07 and 112-19 was all "employment number frenzy" and the market spent little time in that zone. So I chose not to include it in the new box.
On April 8 the market dropped to 110-28, just 3 ticks from the bottom of the box and a good chance to buy if you are bullish (which I was).
On April 12 the bonds broke above the 112-07 estimated top of the box. How much further would they go? Your first guess has to be 46 ticks above 112-07, i.e to 113-21. But you also should keep in mind that when a box lasts a week or more like this one did, the market will usually hestitate for a few days once it gets 1/2 the box size (in this case 23 ticks) above the top of the box. Note the hesitation for a day or so near 113-00.
The bonds reached 113-18 on April 15, only three ticks shy of the estimated top of the projected 46 tick box. What to do? Well, the conservative thing to do is to sell longs and plan to repurchase on a break of near 46 ticks. In this instance you would leave some profit on the table, but remember, you've got to let other people make a living too!
In any case, the market hesitated only a few hours near 113-21 and rallied further to 114-20. Note that 113-21 plus 23 ticks (1/2 the box size) is 114-12. As the market reacts downward from 114-20 where would you buy back your longs (assuming you were still bullish)? Well there are two choices. The first is the previous (and incorrect) estimate of the top of the box at 113-21. This is a fairly agressive play but it makes sense if you are convinced the upside potential is still significant (as I did).
The more conservative answer is to buy a 46 tick break. This would entail buying at 113-06 but the market only got down to 113-09. This illustrates a basic point. If you think the market will stop at a price level identified by the box method, it is usually best to make the trade a few ticks ahead of the level (remember that you have competitors!).
Where is the market now according to the box theory? Well this morning the bonds came down hard from a high at 114-18 (top of the box is 114-20). Usually a move from one extreme of a box ends near the other. The low today is 113-22 but this is 13 ticks away from the low of a 43 tick box, so I would prefer the market to drop further before being a buyer again. (If the bonds are stronger than I think I will regret this!). In any case, as I write this the market has rallied 12 ticks from its 113-22 low, so if the reaction continues, a 12 tick box with high 113-22 would put the reaction low near 113-10. I think the subsequent rally should carrry pretty close to 115-06, the top of the highest projected box on the chart.
Darvas described the box theory as his own invention in his 1961 book "How I made 2 million dollars in the stock market" (Its a fun read and I strongly recomend it). While Darvas may have indeed come up with the box theory on his own, the basic principles have been known to good traders for as long as there have been speculative markets because they neatly fit the observed behavior of all markets.
Will studying the box theory make you a good trader? Probably not, because successful trading requires certain artistic skills and a certain emotional makeup that most people don't have. But if you are one of the few who are cut out for the speculative game, you will find the box theory very useful tool.
Darvas failed to explain his box theory clearly in his books. In this blog I hope to communicate the basic principles of the box theory by illustrating them with some real time examples.
Boxes are often referred to as trading ranges but I prefer the term "box" out of deference to Darvas and also because of its snappy pronunciation. The basic principles of the box theory are easy to state. First, the size of boxes tends to change only slowly. Secondly, boxes of the same size tend to stack on top of one another very neatly. Finally, boxes show the trend direction: an uptrend will show a series of boxes at higher and higher levels and a downtrend will show the reverse.
Let's turn to the bond example above and see how it illustrates these principles.
The weekly trend in the bonds turned up from the 109 low on March 23. Although I have not shown it on the chart, the 109 level was easily projected as a box low using the boxes that had developed in the downtrend from the 117 top in February 2005. The start of the uptrend was then shown when the market broke above the 110-12 level which was the projected top of the last box in the downtrend and the actual low of the second-to-last box in the downtrend.
The first multi-day box in the new bond uptrend developed during the first two weeks of April. At this point I must empasize that delinating and/or estimating the location of the top or bottom of a box requires a certain artistic skill. I am convinced this skill can be acquired through constant practice and I am also convinced that this is the ONLY way to do it!
In any event, the two horizontal solid lines delineate an actual box that is 46 ticks wide. When your think the trend is up you must be a buyer near the lower edge of any box. That bottom edge may have already been formed by a previous price extreme or its location may only be an educated guess made by assuming the new box will be the same size as the preceeding box.
In this case the intial 6 hour rally off of 109 was 46 ticks, so estimating a 46 tick drop from the employment number high of 112-19 would have made you buy near 111-05; the low that same day was 110-25. Note also that the subsequent rally off of 110-25 was exactly 46 ticks! I would then be inclined to say that the box extended from 110-25 on the low side to 112-07 on the high side. The trading that occurred previously between 112-07 and 112-19 was all "employment number frenzy" and the market spent little time in that zone. So I chose not to include it in the new box.
On April 8 the market dropped to 110-28, just 3 ticks from the bottom of the box and a good chance to buy if you are bullish (which I was).
On April 12 the bonds broke above the 112-07 estimated top of the box. How much further would they go? Your first guess has to be 46 ticks above 112-07, i.e to 113-21. But you also should keep in mind that when a box lasts a week or more like this one did, the market will usually hestitate for a few days once it gets 1/2 the box size (in this case 23 ticks) above the top of the box. Note the hesitation for a day or so near 113-00.
The bonds reached 113-18 on April 15, only three ticks shy of the estimated top of the projected 46 tick box. What to do? Well, the conservative thing to do is to sell longs and plan to repurchase on a break of near 46 ticks. In this instance you would leave some profit on the table, but remember, you've got to let other people make a living too!
In any case, the market hesitated only a few hours near 113-21 and rallied further to 114-20. Note that 113-21 plus 23 ticks (1/2 the box size) is 114-12. As the market reacts downward from 114-20 where would you buy back your longs (assuming you were still bullish)? Well there are two choices. The first is the previous (and incorrect) estimate of the top of the box at 113-21. This is a fairly agressive play but it makes sense if you are convinced the upside potential is still significant (as I did).
The more conservative answer is to buy a 46 tick break. This would entail buying at 113-06 but the market only got down to 113-09. This illustrates a basic point. If you think the market will stop at a price level identified by the box method, it is usually best to make the trade a few ticks ahead of the level (remember that you have competitors!).
Where is the market now according to the box theory? Well this morning the bonds came down hard from a high at 114-18 (top of the box is 114-20). Usually a move from one extreme of a box ends near the other. The low today is 113-22 but this is 13 ticks away from the low of a 43 tick box, so I would prefer the market to drop further before being a buyer again. (If the bonds are stronger than I think I will regret this!). In any case, as I write this the market has rallied 12 ticks from its 113-22 low, so if the reaction continues, a 12 tick box with high 113-22 would put the reaction low near 113-10. I think the subsequent rally should carrry pretty close to 115-06, the top of the highest projected box on the chart.
The yield curve
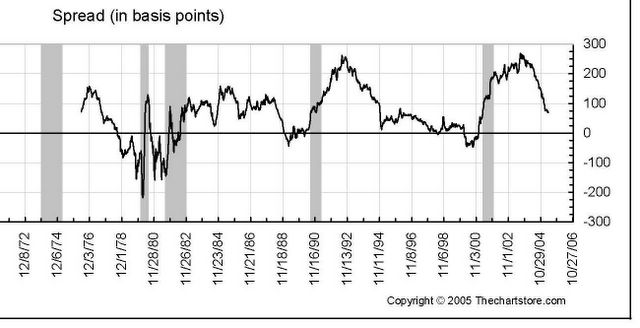
The chart posted below records weekly the difference between the yield on the 10 year US treasury note and the 2 year treasury note. When the 10 year note yields more than the 2 year note this difference is positive and the (interemdiate part of ) the yield curve is said to be positively sloped. A positively sloped curve prevails most of the time as you can see from the chart.
When this yield difference is a very big positive number the curve is said to be very steep. During the summer of 2003 this yield difference was +275, matching the difference recorded in 1992.
The steepness of the yield curve in 2003 is the key to understanding why longer term interest rates have not on average risen nearly so much as short term rates during the current period of Fed tightening.
The first thing to keep in mind is that the Fed directly controls only the Fed funds rate. This is the rate at which banks can borrow overnight to meet their reserve requirements. The funds rate in turn is tightly bound to the level of very short term interest rates (e.g. 3 months or less in maturity).
The rate on the 10 year note is not controlled by the Fed but instead is determined by the market's expectation about two things: the average level of the Fed funds rate over the next 10 years (with a heavier weight given to rates expected to prevail during the next two or three years) and the average level of inflation expected over the next 10 years.
During the summer of 2003 we had two unusual circumstances working together. First, the yield curve was showing record steepness (+275). Morover, this record steepness accompanied an unusually low level of short term interest rates, a level not seen since the aftermath of the Great Depression of the 1930's.
Consequently, there was plenty of room for the Fed to return short rates to normal levels without causing a big rise in the 10 year yield. (The normal level for short term rates is the expected rate of inflation plus the expected rate of economic growth - somewhere between 4% and 5% currently). Indeed, since the Fed action should only serve to decrease inflationary expectations, and since the Fed was only returning short rates to "normal" levels, one would not expect the yield on the 10 year note to change much at all.
This is exactly what happened. When the yield curve was at its steepest in August 2003 the yield on the 3 month treasury bill was about 1 %, the yield on the 2 year note was 1.8% while the yield on the 10 year note was 4.6%. Today, after 18 months of Fed tightening, the three month bill yields 2.9%, the 2 year note yields 3.6% and the 10 year note yields 4.3%. Note that the yields on the 3 month and 2 year paper went up about the same amount - about 200 basis points - while the 10 year note yield actually dropped 30 basis points during the same time.
So far all we have done is "predict the past". What about the future?. Well, you can check out my 2005 bond market forecast posted below. Since the curve has returned to more normal levels during the past 18 months (see chart below) I expect the 10 year notes to start moving more in sync with the shorter term maturities. Sometime this summer or fall I think that both short and long term rates will start moving up together in response to a renewed campaign of Fed tightening. Rates will probably reach their peaks late in 2006.
My 2005 bond market forecast
On January 2, 2005 I sent my market friends a bond market forecast for the year ahead. I thought you might find it fun to read. It illustrates the way I approach the problem of market forecasting
2005 BOND MARKET FORECAST
January 2, 2005
Our first long term bond forecast was published on December 29,1982 when the 10 year treasury note was yielding 10.47%.
The thesis of that forecast was that a new long term cycle in bond prices and interest rates had begun at the September 1981 peak in long term interest rates when the 10 year treasury note was yielding 15.84%. We expected the new cycle to evolve in a way similar to the cycles that had begun at the two previous long term peaks in interest rates in 1857 and in 1920.
We quote from the December, 29, 1982 forecast: "If the bond market follows the average of these two historical cycles then bond prices should be in a generally rising trend for the next 30 years. The peak in bond prices and the low in long term interest rates is not due until the year 2010.....long term bonds are once again a high return, long term investment vehicle and will remain so for a generation to come."
It is our view that this predicted 30 year, long term downward cycle in the 10 year note yield has yet to be completed. This contrasts with today's conventional wisdom which holds that both stocks and bonds are "trash", i.e. both financial instruments should be expected to yield subnormal returns for the indefinite future.
Our own "contrary opinion" is based largely on the belief that the long end of the Treasury market has yet to price in a long term lull in inflation (another contrary opinion of ours!) and that when it does the 10 year notes will be yielding less that 3.00% AND less that the Dow Industrials. ( Currently the 10 year note is yielding 4.27% and the Dow 2.25%.)
Our shorter term forecasts (1 to 3 years ahead) are based largely on hypothesis that the duration and extent of bull and bear markets show a certain consistency over the years. This forecasting technique we developed from a study of the late George Lindsay's methods for forecasting stock prices and it has served us well. We admit that we rely as much upon art as upon science in making these forecasts. They are a series of educated guesses based upon the market's historical record and informed by our own market forecasting experience of nearly forty years.
The current situation in the interest rate markets is unprecedented in the post World War II era of activist montetary policy in the USA. In 2003 the Federal Reserve drove short term interest rates to levels (under 1%) normally associated with depressions and last seen in the US in the 1930's and 1940's. We believe the 2003 low of 0.80% in three month t-bills was well below what could resonably be regarded as normal (perhaps 2.50%) for the level of economic activity at the time. This situation was reflected in the abnormally steep yield curve which in mid-2003 had the 10 year notes yielding 275 basis points more that the 2 year notes.
The interest rate cycle which began from the 2003 lows will therefore look quite different from past cycles associated with economic expansions. This difference will show up largely in yield curve behavior. The curve is stll quite steep as this is being written, but not abnormally so, and our best guess is that the yield curve will continue to flatten until we see 2 year notes yielding less that 3 month bills (an "inverted" curve) while the spread between the 10 year and the 2 year notes will narrow to essentially zero.
Put another way, we think that the short end of the market (securities of less than 2 years maturity) will show steadily rising rates with only occasional multi-month interruptions until sometime in late 2006 or in 2007. On the other hand, the long end of the market (10 year and longer maturities) will on average show steady yields during the same period.
Now for a more detailed look at short term rates. For this we will use the 3 month treasury bill as our interest rate index.
For the past 50 years the 3 month bills have marched in tune with what Lindsay would have termed two long term time periods. The first averages 12 years 4 months from low to high or from high to low, while the second averages 14 years 3 months from low to high or from high to low. To illustrate this principle we observe that the November 6, 2000 high yield of 6.24% occurred 14 years 1 month after the low yeild of 5.05% on October 6, 1986. Moreover, the June 19, 2003 low yield of 0.80% occurred 14 years 3 months after the high yield of 9.10% on March 27, 1989.
The next base point for this calculation is the low yield of 2.61% which occurred on October 1, 1992. Adding 14 years 3 months brings us to January 2007 as the ideal time for the next yield high in 3 month t-bills.
Moves from low to high in 3 month bill yields typically last either an average of 26 months or an average of 42 months. August 2005 is 26 months after the June 2003 low yield of 0.80%. Mooreover, February 2005 is 12 years 4 months after the low yield of October 1992. Therefore we estimate that about May of 2005 the Fed will temporarily suspend its move towards high rates, offering as its reason the assesment that rates at the time are consistent with non-inflationary growth. However, this suspension will last only a few months and will be followed by a move to a tighter monetary policy and this tighening will conitnue to January 20007, 43 months after June 2003.
How high will the 3 month bill yield be in January 2007? The last four trends from lower to higher rates carried the 3 month bills up an average of 340 basis points. This mechanically projects a yield of 4.20% in January 2007. But we must remember that the 2003 low yield was abnormally low and that therefore the current yield upmove should tend to be in the upper part of the range of historical experience. The 1986-89 umove in yields sent 3 month bill rates up 405 basis points and it is this that we choose as our best guess for the current cycle. Thus we expect the 3 month bill yield to be 4.85% in January 2007 (versus 2.25% currently).
We next turn to estimating the yield trend for the 10 year notes.
In this market we find that the 10 year decennial pattern offers some insight, at least if one is careful to use only those precedents which occur in the same part (currently falling ) of the 60 year interest rate cycle. These then would be the years 1984-87 and 1994-1997 since the 60 year interest rate cycle started downward in late 1981.
In our 2004 bond market forecast we estimated that the bear market in the long bond prices which began from the June 2003 low yield of 4.14% would end sometime between July and September 2004 with the high yield on the long bond between 5.88% and 6.04%. This would have been consistent with the 10 year cycle indications of a high yield sometime between May 30 (1984 precedent) and November 7 (1994 precedent), averaging out to about August 20.
In the event the long bond reached a high yield at 5.60% early in May 2004 and has since moved toward lower yields (currently 4.86%). The 10 year note reached a high yield of 4.89% in May 2004 and now yields 4.27%. For the past several months we have been expecting these markets to surpass the high yields reached in May 2004. However, a more careful analysis of the historical data has convinced us that the start of this move up in yields will probably be delayed until the third quarter of 2005.
The first and most obvious clue is that the 10 year pattern predicts that 2005 will be a bullish year for the 10 year note prices and that yields will probably drop until January 2006 (1996 precedent) or April 2006 (1986 precedent).
The long time period for notes averages 13 years 11 months. The May 2004 high yield was 14 years 9 months from the August 1989 low yield. Adding 13 years 11 months to the October 1990 high yield gives us September 2004 for a predicted yield low. However, after a yield high like the May 2004 high yield associated with the long time period of 14 years the market generally declines in yield for 20 months. This would predict a yield low for January 2006. Unfortunately this would be out of the historical range of the long time period which generally does not last more than 14 years 10 months. We therefore compromise on August 2005 as the predicted time for the low yield in the notes.
We next observe that a low yield in the 10 year notes occcurred in October 1993. Adding 13 years 11 months to this date brings us to September 2007 as a projected high yield for the notes. On the other hand, the 10 year pattern predicts high yields either for August 2006 (1996 precedent) or October 2007 (1987 precedent). The average of these last two projections is March 2007, quite comparable to the January 2007 projected high yield in the 3 month bills. Finally, yield rallies in the notes from important lows (such as the one predicted for 2005 or early 2006) average about 15 months in length thus indicating a yield high around November 2006 (15 months after August 2005).
Putting these observations together we make the following deductions. First the drop in yields from the May 2004 highs is not yet complete and will probably continue until August 2005. This date is 18 months after May 2004 and is as close as we can get to the yield lows predicted by the 10 year pattern (January and April 2006) without violating the range of historical experience for the 14 year period.
From the predicted yield low in August 2005 yields will move up for about 15 months (the average duration during the declining phase of the 60 year cycle) until November 2006. We prefer this to the March 2007 date given by the 10 year pattern because the high in short rates (predicted for January 2007) typically follows the high in 10 year yields during the falling part of the 60 year cycle.
How low will the 10 year yield be at the projected August 2005 yield low? We do NOT expect the notes to drop in 2005 below the 3.07% low yield reached in June 2003. Instead we think the 10 year notes will drop to about 3.60% by August 2005 and then rally to 5.20% by November 2006.
From projected yield highs in late 2006 or early 2007 all the interest rate markets should move towards lower yields for about two or three years. That drop in yields should carry the 10 year notes below 3.00% and end the declining phase of the 60 year interest rate cycle that started in 1981.
Carl Futia
Copyright 2005
Monday, April 25, 2005

How High can Google Fly ?
Who Knows! But one thing is for sure. GOOG (The Nasdaq symbol for Google) is nowhere near the end of the upmove that has carried it from its IPO price of 85 to the 224 level last week.
My market friends know that ever since its IPO I have been talking about $500 per share for GOOG by the end of 2005. This just seemed like a nice round number to me, a number that would surely attract attention (to me and to GOOG!).
But my "far out" prediction of $500 for GOOG also illustrates an important forecasting principle. You see, the biggest obstacle to making consistently good market predictions is failure of imagination.
It is a human tendency to project the present situation in markets or everything else into the indefinite future. But a good speculator makes his or her money by anticipating a change in prices that few other people can yet foresee. (If they could the market would already be at its new price and there would be no money to be made!) So to become a good speculator you must learn to exercise your market imagination. You must practice envisioning price levels and price trends quite different from those which currently prevail.
Of course your market imagination must be disciplined by good tools and technique; it can't simply be a flight of fancy or wishful thinking. You must have a good and sensible reason, one based on historical observations, for imagining a big change in the current market situation.
It is not far from the truth to say that a good speculator is an artist. He or she constantly imagines new trends and price levels which will reflect economic circumstances most other people cannot yet foresee. The speculator is in touch with his financial "muse" and his predictions are in an essential way like the inspirations and imaginings of an artist. But, as with any artist, analytical technique plays a critical role. It constrains imagination to express itself through channels known historically to work.
Now let's return to GOOG and apply some technique to discipline our imagination. Most of what follows will seem to be numerological mumbo-jumbo to the more "scientifically" inclined reader. But I assure you that such price numerology plays a bigger role in determining market movements than you can imagine.
GOOG went public at 85 in August 2004 and by early November of that year had hit 201, a gain of 136%. The subsequent reaction ended at 161 later that month. So our first target is obtained by guessing that the next move up will end once GOOG rises 136% from 161, i.e. to 379. (Not quite 500, but oh well---). Let's note something else. Subtracting 85 from 201 gives 116 points. Adding 116 to 161 gives 277 ( a likely resistance level on the way up to over 300) while adding another 116 to 277 gives 393, not too far from 379.
Now lets apply an even more bizarre projection method. The square root of 85 is 9.22. The square root of the November 201 high is 14.17, almost exactly a whole number 5 above 9.22. Adding 5 to 14.17 gives 19.17 and squaring the result gives 367.
So we have three targets obtained in three different ways: 370, 393 and 367. Let me throw in a fourth just to add to the mystery: 85 plus 288 is 373. The average of these four targets is 376 which is now our GOOG target for the end of 2005.
So, plan A is to sell near 376. But every experienced speculator knows that while such targets are fun to develop one always needs a plan B in case the market throws us a sharp curve (an American baseball term referring to a pitch which is very difficult to hit).
Plan B will be to sell GOOG if it starts to lag the market averages by (for example) failing to reach new highs when the averages do or by making lower lows when the averages are making higher lows.
Let's keep our fingers crossed and see how our best laid plans for GOOG work out over the coming months.
Sunday, April 24, 2005
Should You speculate?
Here is my working definition of the word "speculate": buying or selling an asset (e.g. stocks, bonds, foreign exchange, commodities, real estate) to profit from a change in its price over a relatively short span of time (e.g. a year or less).
So, should you speculate?
NO!!!!!!
DON'T DO IT!
YOU WILL BE SORRY IF YOU TRY!
Well, that's a pretty strange piece of advice coming from someone whose business is speculation! But let me try to persuade you it is the right answer to give 99% of the people who are inclined to speculate, whether or not they are smart enough to ask this question in the first place.
First, let's dispose of an obvious issue. I am a speculator. Like any businessman, I don't want competition, so it is in my interest to discourage potential competitors.
To paraphrase John F. Kennedy, let me say this about that. There is an ocean of people out there who speculate, whether or not they do so intentionally. Adding one more speculator is like adding spit to the ocean - it's not going to make a bit of difference. Moreover, to continue our aquatic metaphor, novice speculators are at the bottom of the food chain of the speculative ocean and only serve to fatten up those closer to the top (e.g. me).
Having disposed of the self interest issue, let's return to our original question. Should you speculate?
Well, you probably want to speculate because you think you can make money speculating, enough money to justify the time and effort you put into it. (I am not addressing those who speculate to satisfy their urge to gamble and take unnecessary risks). Fine. But how likely is it that you will really will increase your income and net worth?
It's very easy to become a speculator. All you need is a few hundred dollars and an internet hookup. And that is precisely the problem. Why?
THE BUSINESS OF SPECULATION
Speculation is what economists would call a constant sum game. There is a single "pie" out there that is the compensation to speculators as a group for providing liquidity to markets, improving the price discovery process and providing insurance to producers who want to hedge. The more people who compete for that pie the smaller is the average piece any one individual can reasonably expect to get. And it is so easy to become a speculator that this average piece is very small, so close to nothing at all that you won't be able to tell the difference.
But the situation is worse than that. First of all, trading costs in the form of commissions and bid-ask spreads have to be paid in order to speculate. In other words, brokers get their slice of the speculative pie before anyone else does.
Moreover, we all know that there are hugely successful speculators out there in the investment world. Their success might be due to merely to luck but this is irrelevant. What is relevant is that they "eat" almost all of the remaining pie, leaving only "negative" pieces for everyone else. So when you speculate it is almost certain that you will reduce your net worth in the process of "feeding" brokers and the successful big speculators.
WHAT'S YOUR EDGE?
"Wait a minute", you might interject, " I'm quite a bit smarter that the average person. Why won't this allow me to succeed as a speculator, at least if I am willing to pay the reasonable cost in time and money of a normal apprenticeship. After all, I have been very successful in my current profession of ...... (e.g. law, medicine, small business, big business, etc.).
Sad to say, intelligence has little to do with success in speculation. Indeed, my observation is that the biggest losers in the speculative game are people of above average intelligence. It is their intelligence that helps them make the money that they then proceed to lose to the "street smart" speculators at the top of the food chain. And it is their intelligence that misleads them into thinking that markets behave according to the simple logic of the business world in which they have been so successful.
What is really needed for successful speculation is not intelligence but what speculators call an "edge". An edge is a piece of knowledge or a reliable instinct which predicts the direction of market prices and that is not shared by too many other speculators.
You can't get an edge by reading the finance or technical analysis books you bought on Amazon or at Barnes and Noble. The information they contain is fine as far as it goes, but the trouble is that it is information that everone else has too! It can't give you an edge on other speculators. For the same reason you can't get an edge by attending a seminar that promises to reveal market secrets which will lead you to wealth.
Successful speculation requires that you outguess other speculators who are probably at least as smart and experienced as you are. Why do you think you can do this? What special knowledge do you have that few other people have? What's your edge?
If you think about this question honestly you will probably conclude that you don't have an edge. And if you don't have an edge you must not speculate.
SKILL IN SPECULATION
Many people (including most economists) believe that there is no such thing as skill in speculation. More precisely they think that most investment and speculative success is indistinguishable from the result of blind luck. The more dogmatic ones say that Warren Buffet is just lucky, not good. For a good read on this subject I urge you to get Nassim Taleb's terrific book "Fooled by Randomness".
I don't share this view. I think that successful speculators have a tangible skill, although it is not a skill that can be taught. Their skill is the ability to sense the direction in which the crowd ("flock" and "herd" are perhaps more informative images) of other speculators is about to turn, just at the point this turn is starting.
WHAT TO DO IF YOU DON'T SPECULATE?
Read William Bernstein's book "The Four Pillars of Investing" and follow the advice in that book. Bernstein also has a web site.
So take my advice. Don't speculate. And please follow William Berstein's advice when it comes to managing your investments. He knows what he's talking about.
Saturday, April 23, 2005
Forecasting Giants of the Past
In 1981 a fellow named Joseph Granville had become so influential a stock market forecaster that in January of that year one of his "sell signals" sent the Dow Industrials downs almost 3% in a single day. Granville himself announced soon after that he never would make another forecasting mistake and put a claim in for the nobel prize in economics. Sad to say, Granville remained bearish through the explosive start of the great bull market which began in 1982 and this destroyed his reputation as a market guru.
At the height of the Granville phenomenon a market analyst named James Alphier published a report in which he summarized Granville's record. He then compared it to the records of the few market gurus who were truly forecasting "giants" because of their long records of successful predictions. Alphier concluded that many aspiring gurus were "hot" (i.e. accurate) for three to five years, but that most of them soon lost their touch. Only a few managed to sustain records of tremendous accuracy for a period of 10 years or more.
Sadly, Alphier passed away prematurely in 1990 at the peak of his own career. But I think his essay on this subject is so insightful and interesting in its historical observations that I want to reproduce it below
Here is Alphier's 1981 report entitled "Granville in Perpective".
GRANVILLE IN PERSPECTIVE (copyright 1981 by James Alphier)
As anyone who follows the stock market knows, considerable interest and controversy surrounds the analytical activities of Joseph Granville. While a great deal could be written on the subject, there are questions we do think useful for investors to answer:
- How has his accuracy compared to other stock market prognosticators in the past?
- Based upon past experience with other forecasters, what probability does he have of continuing his record?
There is a great deal more that could be written, in terms of comparing methodologies and other topics, but we think the answers to these two questions will be sufficient to gain a perspective.
THE GRANVILLE RECORD
Anyone who views a chart of [the Dow] [from] 1977 to the present [1981] will see several pronounced, large price swings. The indisputable fact and the sole claim to unusual forecasting ability which Granville possesses is that he has simply indicated the termination of every one of them very close to the extreme reversal point.
Because Granville was bullish the entire period from 1972 to the beginning of 1977, we are not including his correct bullishness during 1975-1976 in his record. We are counting from reversal of opinion to reversal of opinion. We believe this is the only fair way to go about it. Prior to 1975 by his own statements Granville was nothing but a mediocre market analyst, with some correct forecasts and some incorrect forecasts. He was rightly bullish during the latter half of 1970. As noted, he stayed bullish throughout the historic 1973-74 bear market. In 1966 he missed both the top and the bottom of that short-lived, but painful, bear market.
Granville makes no particular claims about a consistent ability to select individual stocks. Such a record of all recommended issues or groups is not available except to a person who goes back through years of his market letters themselves. One recent private study of his stock selection acumen is cited in BARRON'S, January 12, 1981, page 38. This study claims poor net results.
Whatever claims may be made as to continued future accuracy, the bald fact is that he has established his reputation completely on his skill in forecasting significant swings in the Dow Jones Industrial average over the past four years.
The first question that may be asked is, "How often has an analyst, whose research is publicly available, been able to do something like this in the past?" The answer is, that for periods of as little as four years, there have been many analysts who have been able to (1) forecast the major market averages, (2) nearly coincide with the extreme high or low, and (3) do this on the significant swings. We could not, in fact, list all the them because there are doubtless several of whom we are unaware. Here is a random sampling of analysts who made truly exceptional forecasts meeting the criteria listed above for particular periods: Karl Kaiser (1957-1961), John Denninger (1965-1968), Burns and Kirkpatrick (1972-1975). This is very far from being an exhaustive list.
In these, and most other cases we could cite, there is a tendency after three to five years of near perfect forecasting for the analyist to make one or more major errors. We will not recount the many painful examples of this in our files. There have been some, however, who have been able to sustain tremendous accuracy over much longer periods.
FORECASTING GIANTS OF THE PAST
Major L. L. B. Angas began forecasting the New York and London stock markets after World War I. He was substantially correct in forecasting the booming markets of the 1920's, the 1929 top, the 1932 low, and other major swings in the stock market during the period ending just before World War II. He also made a series of correct economic forecasts as well during this period of time. After almost three decades of unusual foresight, his analysis became much less accurate.
Hamilton Bolton started the "Bank Credit Analyst" in 1949, in part using ideas which had been developed by a now-obscure analyst named Harding. In the early 1930's Harding developed a theory of tracking the flow of money and credit in the banking system. Between 1949 and Bolton's death in 1966, his service correctly predicted all of the major bull and bear swings experienced by the stock market with but two exceptions: being bearish in 1951-52 during a basically flat, trading range market, and missing the 1962 collapse. The latter, Bolton correctly maintained, was purely psychological and would be more than completely retraced. In addition, Bolton established beyond question that money and credit flows as measured by statistics provided by the banking system itself had an important effect on the general level of stock prices. Many of his ideas are now widely accepted by stock market analysts and economists. Since 1967, the basic theory has continued to "work" non-randomly, but not nearly with the precision it had before.
George Lindsay started in the early 1950's with an advisory letter, and began issuing detailed annual stock market forecasts in 1958. These were based on his unique theory of "repeating time intervals" which still stands at right angles to all other forms of analysis. These forecasts actually indicated probable dates of significant highs and lows in advance and their likely amplitude! During this time, any person who dared follow these forecasts would not have been caught substantially unaware by any worthwhile market swing. The year 1970 ended a long success streak when the dramatic March-May collapse was very much understated and given less than high probability of occurring. Mr. Lindsay is still practicing and while having made some errors has continued to compile a highly non-random record considering the type of forecasting he does.
Edson Gould began writing a market letter more than three decades ago. Up until 1976, he had correctly called all major bull and bear markets, often just a few days from their exact termination. He had no misses during this time period. Since 1976 his constant bullishness has, in fact, been borne out in the broad, unweighted price indices, but not in the Dow Industrials. Nor did he correctly anticipate the steep drops of October 1978, October 1979 or February-March 1980.
In our opinion, the ultimate crown for sustained accuracy and forecasting acumen must be bestowed upon the late Paul Dysart. Between 1945 and 1967, with only three minor exceptions, Dysart called all major bull and bear markets very close to their extremes. His average error in both points and time was very close to zero. In 1958, 1963 and 1964 Dysart recorded "false" sell signals which he quickly realized were incorrect and took them back. Unlike every other analyst we have labeled as a "forecasting giant", Dysart also had an ability to select issues for long-term investment. His compact list of recommended stocks over this twenty-two year span had a grossly disproportionate number of exchange-traded issues which racked up multi-hundred percent gains and which genuinely enriched a small but loyal band of subscribers.
INVENTORS OF METHODS
Insofar as we know now, Angas, Lindsay, Gould and Dysart developed their unique forecasting methods "on their own". Their track records are monuments to original research. It is clear, of course, that they were influenced by other researchers, but their work was largely their own.
Most of the original core of Bolton's concepts , as noted, came from Harding, although we are not aware of Bolton's acknowledging this fact. However, he certainly did considerable research on his own, and greatly expanded the original body of ideas.
One particular methodology (which has several derived indicators) and is - according to Granville - vitally important to his forecasting is On-Balance-Volume or OBV. There is no reason whatever to doubt Granville's claims of having invented it in the summer of 1961 but it should be recognized that very similar work on volume had been independently performed at least as early as 1955.
THE BOTTOM LINE
At this point in time (February 1981) Granville is pushing against the normal, three-to-five year limit which has seen the great majority of near-perfect forecasters of the past make an important error. He has considerable company among the legions of market analysts, past and present.
The main difference is that Granville has been promoted to an extent previously unheard of for a market letter writer- although even here some Wall Street figures prior to World War I who were proportionately as famous.
The shortest near-perfect record among those we have dubbed "forecasting giants" was twelve years, and the longest was over thirty. All things being equal, the ability of Granville to join the giants will depend upon his being able to continue doing as he has for another decade. This in turn will not only depend upon the efficacy and durability of his analytical methods, but surely upon many other factors as well.
POSTSCRIPT (added by Carl Futia on April 23, 2005).
Granville's hot streak ended in August 1982 when he missed the start of an enormous bull market and then stayed bearish for many of the subsequent years. His collapse as a forecaster was as spectacular as his rise. Note that his "moment in the sun" lasted just a few months longer than the three-five year period predicted by Alphier (who clearly did not rank Granville among the giants).
The next famous guru to come along was Bob Prechter of the Elliott Wave Theorist. Prechter was spectacularly successful during the 1982-87 bull market period in the Dow. But then from 1987 onward he consistently predicted an imminent crash and depression, so I think it fair to say that his "hot streak" lasted five years too.
I know of no "market timing" gurus who emerged during the 1990's and this is probably due to the fact that the stock market marched steadily upward during that period with scarcely any observable pauses. My guess is that the year 2000 marked the start of a more normal environment with many up and down swings. For this reason I expect to see more gurus attract public attention during the coming years.
Friday, April 22, 2005
The Story of Google
Google had its IPO (initial public offering of its stock to the public) on August 18,2004 and began trading on the Nasdaq on August 19. The IPO price was 85. As I write this GOOG (Google's symbol on the Nasdaq) is trading at 224 after yesterday's very positive earnings announcement.
I have been very bullish on Google ever since its IPO as my market friends will attest. Why? My bullishness has really been a deduction made using contrary opinion techniques.
First the backdrop. The Nasdaq 100 index had dropped more than 80% from its 2000 high around 4800 to its 2002 low at 800. Tech stocks had been killed and many dot com companies had gone bankrupt. Enron and Word Com had vaporized and the whole telecom sector was a disaster area. The public hated tech because the collapse of tech and telcom stocks caused a meltdown in their 401k's and had forced them to give up dreams of early retirement.
Google is a search engine company, placing it squarely in the middle of the tech and dot com sector. Its IPO was widely discussed during the spring and summer of 2004. Some people thought the IPO price would be as high as 135.
In the event, Google's novel "reverse auction" (which cut out the investment banker middlemen) yielded an IPO price of 85, quite a bit below hopes and expectations. This perhaps shouldn't have been too much of a surprise given the public's new found skepticism (born of heavy losses) about dot com stocks:
"Gloomy IPO market wonders about life after Google's entry", Wall Street Journal, 8/23/2004
"Weak demand leads Google to lower its sights", New York Times, 8/19/2004
"How miscalculations and hubris hobbled celebrated Google IPO", WSJ, 8/19/2004.
And here's my favorite one:
"IS NOW THE TIME TO BUY GOOGLE? Though price is now lower, history suggest waiting six months to grab an IPO", WSJ, 8/19/2004.
On 8/19/2004 GOOG closed at 100. Six months later, on 2/17/2005 GOOG closed at 198.
My basic impression, developed by reading the popular press' comments on Google during August, September and October of 2004, was that opinion leaders WANTED Google's stock price to collapse. They HOPED that those "arrogant dot commers" and the fools who bought GOOG after its IPO would soon learn the lesson the public had learned during 2000-2002: tech was trash.
I had one other reason for being bullish on Google. I thought that the general public didn't want to hear about investing in stocks and that as a consequence there wouldn't be many exciting "story stocks" around to be driven higher mostly by hopes and dreams. So a very big chunk of the hedge fund and day trader money and tech fund money would have nowhere to play but in Google's stock. So I expected GOOG to inflate beyond any reasonable expectation.
Today GOOG traded at 224. Is this the top? I doubt it. In fact I think that during the next year GOOG will double from its current levels (YIKES!)
Yikes !!!
On March 26, 2005 I sent the following memo to a few of my market friends:
March 26, 2005
YIKES !!!
I've been going through the recent additions to my market scrapbook of newspaper and magazine clippings. I have kept this scrapbook for many years and it is a great help in identifying widely held beliefs about investment opoportunities. My basic rule of thumb is that any view of the future that is widely held is probably wrong and this is especially true of pessimistic beliefs.
With this in mind here is a list of what I think are today's widely held market beliefs.
1. The Fed will continue to tighten and this means that longer maturity bonds are bad investments at the present time.
2. Stocks are overpriced based on standard valuation yardsticks. Earnings growth is slowing down and the Fed is tightening. The dollar will stay weak and oil is going higher. For these reasons the US stock market is not a good investment.
3. Real estate prices are way out of line with values and income and so real estate is a bad investment now.
4. The US dollar will stay weak because of large, continuing trade and budget deficits. so dollar denominated assets are not good investments.
5. Inflation is headed higher led by oil prices which are headed for $60 to $100. Even worse, oil production world-wide should peak in 2006 (New York Times, op-ed, March 25, 2005).
6. In general "there is too much capital in the world. And that means that those who own capital - investors - are in for some unhappy times". (Floyd Norris, New York Times business columnist, March 25, 2005).
YIKES !!!!! THERE ARE JUST NO GOOD INVESTMENT OPPORTUNITIES AT THE PRESENT TIME!
You may safely conclude that I think that the views expressed by items 1 - 6 above will be contradicted by market movements over the the next year.
Thursday, April 21, 2005
The New York Times and the US dollar
Carrying on with the contrary opinion theme of my last post I want to point out another very unusual publishing event for the NY Times.
In its lead editorial on April 2, 2005, entitled "Before the Fall" the Times editorialists made a dramatic and completely unhedged prediction:
"The recent rally in the United States dollar notwithstanding, the greenback has nowhere to go but down" (lead sentence of the editorial). "The dollar is heading down, no matter what" (opening sentence of last paragraph).
I don't ever remember the Times making an unhedged prediction about the direction of a finacial market in an editorial before this.
On April 1, 2005 the Federal Reserve's US dollar index stood at 84.40. Today the index is at 83.80. The lowest point for the index during the 2004-2005 period was 80.55 on December 30, 2004. Using the NY Times editorial as market guidance I predict that the index will hit 100.00 before it drops below 80.00.
Of course the NY Times is not the only reason I am bullish on the dollar. Those of you who read Newsweek magazine might remember the cover of its March 21, 2005 issue "The incredible shrinking dollar". (Sorry, couldn't find a link to this cover.) One should draw the same inference from this as from the New York Times editorial: sell your villa on the Riviera and buy in Palm Springs.
Contrary thoughts on the US stock market
I like to track the state of market sentiment by keeping a scrap book filled with items cut out from local and national newpapers and magazines. I learned this technique from a fellow named Paul Macrae Montgomery who publishes a newsletter called Universal Economics .
Back in the early 1980's Paul got the clever idea of looking at the covers of Time Magazine for clues about public sentiment on economic questions. The basic idea is that magazines are in the business of telling people what they want to hear. So, when Time publishes a cover like the one of July 29, 2002 asking people if they ever will be able to retire since stocks were then plummeting, you can fairly conclude that public sentiment about the stock market is fearful and bearish and that a low point in the stock market averages is near at hand. And that is exactly what happened in this instance.
The same principle works when applied more broadly. I prefer this method for gauging public sentiment to the more mechanical (and more popular) ones which rely upon surveys of investor or market newletter sentiment. My method requires a lot of experience to use well but is in my opinion much more reliable.
Since March 7, 2005 the Dow Industrial Average has dropped nearly 1000 points from a high near the 11000 level while the S&P 500 has dropped from 1229 to 1140 during the same time. Yet on April 16, April 18 and and April 21 the national edition of the New York Times had front page (above the fold) stories (one a headline) on the stock market:
April 16: " Stocks plunge to lowest point since election"
April 18: " As stocks slide, investors focus on earning data" (headline)
April 21: " Inflation fears pummel stocks"
I cannot remember the last time the NY Times printed negative, front page stock market stories within such a short time frame. My conclusion: The stock market has either made its low or will soon do so, only a few percentage points below current levels. By the end of the year look for all the major averages to climb well above the high points established in March 2005.
Subscribe to:
Posts (Atom)