Wednesday, May 31, 2006

S&P On the Close


Here is an updated 15 minute bar chart of the S&P which I commented on an hour or so ago.

I thought the downside volume burst meant that the market would drop further but instead it rallied. I think it will bounce off of resistance at 1275. This would give the move up from 1256 a three phase look and clear the way for a drop to 1250.

S&P Update


Here is an updated 15 minute bar chart showing regular hours trading in the June S&P e-mini futures. I commented on this chart this morning.

I thought the S&P's would continue upward to 1275 but in the event the market could only reach 1272 which I take to be a sign of weakness. After the release of the Fed minutes the market broke sharply on very high volume. The subsequent recovery occurred on substantially diminished volume. This too is a clue that prices are headed lower. My short term downside target remains 1250. After that level is reached I think a move to 1295 will begin and be the final phase of the rally from last week's 1246 low.

S&P


Here is a 15 minute bar chart showing regular hours trading in the June S&P e-mini futures. I last commented on this chart here.

I have been thinking that the market would compete the second phase of a three phase rally at 1256 and then begin the third phase up to 1295. Early this morning the S&P's dropped to 1256 in electronic trading (not shown on the chart) and have since rallied nearly to 1272.

So far, so good. But I am bothered by the fact that the drop from 1284 to 1256 does not have a clear three phase structure. So in this morning's guessimate I said that the market should bounce off of resistance near 1269 and then drop to 1250 or so. This would give the move down from 1284 to 1250 a clear three phase shape.

As you can see the S&P's have moved visibly above the 1269 level so I think they will continue a bit further to 1275 or so. But I still think another break to 1250 or so is likely before the market can begin its move to 1295.

Silver


Here is an hourly chart showing pit and electronic trading in July silver futures. I last discussed silver here.

I thought that silver would rally up to 1375 or so before turning lower but in the event the market only could make it to 1336. Now I think the three phase rally is over and that silver is headed for the 3 and 1/8 multiple of the 351 low which stands at 1097.

Gold


Here is an hourly chart showing pit and electronic trading in June gold. (I soon will be switching to the August contract which is trading about 6 dollars over June.) I last commented on gold here.

For the last couple of days I thought the market would continue up to its last top near 675 and then resume its downtrend. It only made it to 664 and the price action during the last hours is telling me that the market is now headed for 600 or so. I think that gold will drop to the 2 and 1/8 multiple of its 252 low which stands at 535 over the next couple of months.

Guesstimates on May 31, 8:50 am ET

June S&P Futures: The market hit the 1256 target early this morning and has since rallied to 1266.  The drop from yesterday’s high at 1283 does not have a three phase look so I expect the market now to bounce off of resistance near 1269 and then drop to 1250 or so.  From there a rally to 1295 should commence.

June Bonds: The bonds are on the way down to 106-00. Resistance today is 107-00. Over the next few weeks the market should reach the 110-111 zone.

June 10 Year Notes: The notes should soon reach support at 105-04. Resistance today is 105-20. Over the next few week I expect the market to rally into the 107-108 zone.  

Euro-US Dollar: The 129.20 level is resistance and the short term trend has turned downward once more. A break to 126.30 and eventually lower is underway.

Dollar-Yen: The yen is now on its way to 113.60. The market is preparing for a move up to 130.

July Crude: The market has begun a breaks which should carry to 66.50 before another rally starts.

June Gold: Gold is still likely to rally to 675 before another break starts. Downside target over the next few weeks remains the 2 and 1/8 multiple of the 252 low which stands around the 535 level.

July Silver: Silver now appears headed for resistance around the 13.70 level. After that the market should drop to 1100.

Google: I think Google will hold the low at 360 and rally to 410.

Tuesday, May 30, 2006

Crude Oil


Here is an hourly chart showing pit and electronic trading in July crude oil futures. I last commented on this chart here.

The market has hit 72.80 resistance after completing a three phase rally. I think this means that it is headed back down again and should reach the 66.00 level before another significant rally develops.

S&P


Here is a 15 minute bar chart showing regular hours trading in the June S&P e-mini futures. I last commented on this chart here.

I think the second phase of the upward correction from last week's 1246 low is underway. It will probably drop the futures to support around 1256. From there I will be expecting the third phase rally to carry to 1295 or so. Then the final drop of the downward correction from the May 5 top at 1331 should carry the market down to 1235 or so.

A Bear in the Woods


Here is the cover of the current issue of The Economist magazine. It shows a bear peeking out from behind a tree in the woods.

As you know I think the news media are in the business of telling people what they want to hear. So this cover story is more evidence of a high level of bearish sentiment towards the US stock market. This evidence is consistent with that provided by the Rydex cash flow ratio and by my reading of the front page of the New York Times.

The correction from the May 5 top in the averages still shows only a single down phase so I expect another drop which will carry the S&P cash index to 1230 or so. Because bearish sentiment is already so pervasive I think that a drop bigger than this is very unlikely.

Since the break from the early May high has been only 6% this high level of bearish sentiment also makes it very likely that the averages will make new highs for the bull market within a couple of months.

Dow Industrials' 3 Peaks and a Domed House


I last disussed the evolution of one of George Lindsay's Three Peaks and a Domed House formations in the S&P 500 in this post. I thought you might like to see the corresponding formation in the Dow Industrials.

I have labeled the chart above with blue numbers showing the points of the formation which correspond to the template you can see here. This is what Lindsay would call a major formation because the time from the first peak labeled 3 and the third peak labeled 7 is between 6 to 9 months.

This major formation in the Dow is in some ways more symmetrical than the one in the S&P 500. In particular, the dome of the domed house which comprises points 21, 23, and 25 has a very square shape ( a small "head and shoulders") unlike the lopsided, downward sloping shape of the dome in the S&P 500.

Note that like the S&P 500 the recent action in the Dow also has traced out a minor three peaks which I have labeled with red numerals 3, 5, and 7. This is evidence that once the current reaction ends at blue point 26 and red point 10 there will be a rally to new highs for the bull market. This rally will end at blue point 27 and red point 23.

Lindsay observed that the drop following the completion of the domed house in a major formation typically carries the market to the level at which the entire formation started. In my view this is the 9800 level of the October 2004 low in the Dow.

Guesstimates on May 30, 8:50 am ET

June S&P Futures: The market has nearly reached 1285 resistance.  The next development will be a drop to 1260 or a bit lower. After that a move to 1295 which will complete a three phase rally from the recent 1246 low.

June Bonds: The bonds are on the way down to 106-00. Resistance today is 107-08. Over the next few weeks the market should reach the 110-111 zone.

June 10 Year Notes: The notes should soon reach support at 105-04. Resistance today is 105-20. Over the next few week I expect the market to rally into the 107-108 zone.  

Euro-US Dollar: The market didn’t quite make it to 129.20 and now the short term trend has turned downward once more. A break to 126.30 and eventually lower is underway.

Dollar-Yen: The yen is now on its way to 113.60. The market is preparing for a move up to 130.

July Crude: The market reached the 72.80 resistance level last night and now I think it will turn lower.  Next downside target is 66.50.

June Gold: Gold now appears to be headed for the 675 level again. Downside target over the next few weeks remains the 2 and 1/8 multiple of the 252 low which stands around the 535 level.

July Silver: Silver now appears headed for resistance around the 13.70 level. After that the market should drop to 1100.

Google: I think Google will hold the low at 360 and rally to 410.

Friday, May 26, 2006

Guesstimates on May 26, 8:50 am ET

June S&P Futures: The market has nearly reached 1285 resistance.  The next development will be a drop to 1260 or a bit lower. After that a move to 1295 which will complete a three phase rally from the recent 1246 low.

June Bonds: The bonds are on the way down to 106-00. Resistance today is 107-08. Over the next few weeks the market should reach the 110-111 zone.

June 10 Year Notes: The notes should soon reach support at 105-00. Resistance today is 105-20. Over the next few week I expect the market to rally into the 107-108 zone.  

Euro-US Dollar: The market will now rally  to 129.20.  After that a break to 126.50 and lower is likely to develop.

Dollar-Yen: The yen is headed back down to support at 111.00. After that a rally to 114.50 will develop. The market is preparing for a move up to 130.

July Crude: I still think the market will rally to 72.80 before dropping much lower.

June Gold: Gold should bounce off of resistance near 652 and then head down into the 605-10 zone.  Downside target over the next few weeks is the 2 and 1/8 multiple of the 252 low which stands around the 535 level.

July Silver: Silver is headed downward again and will probably continue down to 1100 or so.

Google: I think Google will hold the low at 360 and rally to 410.

Thursday, May 25, 2006

S&P


Here is a 15 minute bar chart showing regular hours trading in the June S&P e-mini futures. I last commented on this chart here.

As you can see the market has definitely broken above the last rally high which was established just prior to yesterday's 1246.75 low. I think this means that the market is headed for 1285 in a classic three phase advance (pictured in green on the chart). In turn the move to 1285 will probably be only the first phase of a bigger advance to 1295 with the second phase dropping the market to1260 or a bit lower. After the 1295 level is reached (probably 10 days from now) I will be expecting a move down into the 1230-40 zone to complete the entire correction from the May 5 top at 1331.

Guesstimates on May 25, 8:50 am ET

June S&P Futures: The market is now on its way to 1285. This should prove to be the first phase of a bigger, three phase rally to 1295 or so. The drop from 1331 still looks like only the first phase of a bigger three phase drop which will probably carry the S&P down to 1230 or so. After that I still expect a move to 1350 or higher.

June Bonds: The bonds are on the way down to 106-00. Over the next few weeks the market should reach the 110-111 zone.

June 10 Year Notes: The notes should soon reach support at 105-00. Over the next few week I expect the market to rally into the 107-108 zone.  

Euro-US Dollar: The market stopped 30 pips shy of my 129.20 target yesterday and now is on its way down to 126.50.

Dollar-Yen: The yen is headed back down to support at 111.00. After that a rally to 114.50 will develop. The market is preparing for a move up to 130.

July Crude: I still think the market will rally to 72.80 before dropping much lower.

June Gold: Gold is headed down into the 605-10 zone over the next day or two. Downside target over the next few weeks is the 2 and 1/8 multiple of the 252 low which stands around the 535 level.

July Silver: Silver is headed downward again and will probably continue down to 1100 or so.

Google: I think Google will probably the low at 360 and rally to 410.

Wednesday, May 24, 2006

NYSE Advancing Issues


Here is a daily line chart showing the number of issues traded on the New York Stock Exchange that advance in price each day. The pink line is the 5 day moving average of this numberwhile the red line is the 10 day moving average. I last commented on the NYSE advancing issues indicator here and here.

The bullish divergence which began last week is still evident and the averages have made two lower lows even as the daily count of advancing issuses has made two higher lows. This shows that the selling pressure of the past two weeks is lifting and we should see a substantial rally now.

I think that once the market rallies for a week or two it will head down again into the 1230-40 zone. When it does I expect to see both the 5 and 10 day moving averages remain above the levels we have seen over the past week. Such action would set up a much more important bullish divergence and be evidence that new bull market highs lie ahead.

S&P Update


Here is a 15 minute bar chart showing regular hours trading in the June S&P e-mini futures.

Earlier today I said that I thought the market had made a higher low at 1255 and was about to rally over the 1270 level. In the event only a brief rally ensued and the market subsequently dropped to the 1246.75 level, the low in electronic trading after yesterday's close.

This makes this morning's high at 1267 the top of the last rally prior to the low. I think I see two consecutive higher reaction lows on the 15 minute chart since the 1246.75 low and this is a small piece of evidence that the market is about to rally above 1267. Once this happens it should move up to 1285 in a typical three phase corrective move.

Crude Oil


Here is a condensed hourly chart showing pit and electronic trading in July crude oil futures. I last commented on this market here.

It now looks to me like the market is in the third phase of a three phase rally from its recent low. My target for the third phase top is 72.80. Once it is reached I expect the market to resume its drop toward 60.00 and below.

S&P


Here is a 15 minute bar chart showing regular hours trading in the June S&P e-mini futures. I last commented on this chart here.

I think the market has just completed a reaction to a low above yesterday afternoon's electronic low at 1246.25 (not shown on the chart). The subsequent rally should carry above yesterday's high and this will confirm the start of a bigger three phase rally. The first phase of this rally should carrry to 1285.

3 Peaks and a Domed House Update


As you know I have been following the evolution of several possible versions of George Lindsay's 3 Peaks and a Domed House formation over the past two years. The chart above updates my views about the status of the domed house which started from last October's low of 1168 in the cash S&P 500.

The standard time projection for the peak of the domed house (point 23 in the template you can find in this post) is that point 23 will occur 7 months and 10 days after point 14. In the present case this works out to June 5. At the moment the best interpretation I can make is that point 23 was in fact the high we saw on May 5 and that it will be point 25 that will be timed by the 7 month and 10 day period.

This will give the whole dome (points 21, 23, and 25) a lopsided appearance (i.e. it slopes down and to the right) but Lindsay often said that every example of a domed house tends to depart in some way from the template.

The real issue is whether or not the 1326 high at point 23 was the end of the bull market which started from 768 in October 2002.

My own view is that the bull market is not over. Here's why.

First, the drop from point 23 has stayed within normal bounds for a correction within this bull market. I don't see any reason based on the weekly chart action to think the sequence of higher lows formed by successive intermediate term lows has been or will be broken.

Second, as I discussed in this post, I think Lindsay basic advances started from the October 2004 and from the April 2005 lows. I thought that these might end early in June 2006 thus making both subnormal in duration. However we have seen a long series of basic advances over the past 8 years that has alternated between extended and subnormal durations. This is a very long sequence of alternating lengths I am beginning to think it might now be broken. If so the current basic advances may well last well into this summer or fall and be simply normal in duration.

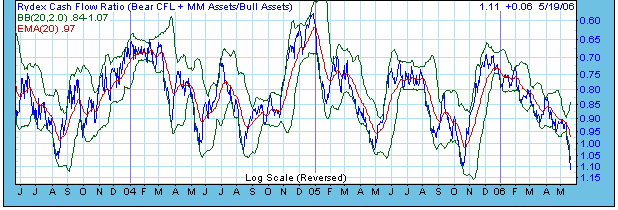
Finally, I see an awful lot of bearish sentiment develop on what so far has been only a 6% drop from highs made less than 3 weeks ago. This suggests the drop is almost over, not just starting.

I have sketched in two possible completions of the domed house. My favored version places point 25 as the end of a second phase rally from lows the market is making this week. Point 26 then ends the correction and is followed by a new bull market high as point 27 at 1350 or higher. Then the final break of the domed house develops which should carry the market down below point 10 (1168) and probably down to the start of the entire 3 peaks and domed house formation (the 1060-1100 range).

If I am wrong and the bull market really has ended then point 27 will develop somewhere below point 23 but the ultimate downside target will be the same.

There is an additional reason for thinking that the bull market high will come at point 27, not point 23. On the chart I have noted in red numbering a minor version of a three peaks (red 3, 5, and 7)and domed house which is still less than half complete. What will be point 26 in the major formation will be point 10 in the minor one. The domed house advance normally carries the market above the highest of the 3 peaks. Thus point 27 in the major formation would correspond to red point 23 of the minor formation and should be a new bull market high.

Guesstimates on May 24, 8:50 am ET

June S&P Futures: Yesterday’s late break carried quite a bit further than I expected it to but I still think that the next development will be a rally starting today and carrying the market to 1285. The drop from 1331 still looks like only the first phase of a bigger three phase drop which will probably carry the S&P down to 1230 or so. After that I still expect a move to 1350 or higher.

June Bonds: Resistance today is at 108-02. The next significant move should be a drop to 106-08.  Over the next few weeks the market should reach the 110-111 zone.

June 10 Year Notes: Resistance is at 106-02. The notes should soon reach support at 105-00. Over the next few week I expect the market to rally into the 107-108 zone.  

Euro-US Dollar: The market broke late yesterday but has since rallied and I think it will reach 129.20 before heading lower again.

Dollar-Yen: The yen bounced off of support near 111.00 yesterday but I think the third phase of the correction from 112.93 is about to start and will carry the market down to 110.50. After that a rally to 114.50 will develop. The market is preparing for a move up to 130.

July Crude: I think crude made yet another lower top yesterday and a drop to 60.00 and below is underway.

June Gold: Gold didn’t manage to reach 682 yesterday but is now headed downward again. Downside target over the next few weeks is the 2 and 1/8 multiple of the 252 low which stands around the 535 level.

July Silver: Silver is headed downward again and will probably continue down to 1100 or so.

Google: I think Google will probably hold Friday’s low at 360 and rally to 410.

Tuesday, May 23, 2006

Silver


Here is an hourly chart showing pit and electronic trading in July silver futures. I last commented on silver here.

In this morning's guesstimate I said that 1300 was resistance in silver but the market has traded higher to 1320. I think 1330 will be it for the rally and that the drop to 1100 will soon resume.

Gold


Here is an hourly chart showing pit and electronic trading in June gold futures. I last commented on gold here.

In this morning's guesstimate I said that gold would rally to 673. That level has been reached but I do not see any sign of a turnaround yet. So I think the market will move a bit higher into the 682-85 range and then resume its drop to 535.

T-bonds


Here is an hourly chart showing regular hours trading in the June T-bond futures. I last commented on the bonds here.

I think the market is in the middle of a reaction from yesterday's 107-26 high. I expect this drop to assume a classic three phase shape by the time it ends near support around the 106-08 level.

The bonds made a low at 105-11 in electronic trading on May15. I think that low is going to hold for several weeks as the market rallies into the 110-111 zone. In fact I also believe that the odds are better than even that 105-11 ended the entire drop from the 119-23 high in June 2005 and that 105-11 will turn out to be the low tick of 2006.

S&P


Here is a 15 minute bar chart showing regular hours trading in the June S&P e-mini futures. I last commented on the S&P's here.

As you can see the market has stalled all day at the high of the last rally prior to yesterday's 1255.25 low. Generally speaking, a stall near an old high or low leads to a move in the opposite direction. This is what I think will happen here. My best guess is that the market is about to drop to 1261-2. After that level is reached I expect a third phase rally to 1285.

The entire 30 point move from 1255 to 1285 should in turn prove to be only the first phase of a larger, three phase rally which will halt near the 1300 level.

Guesstimates on May 23, 8:50 am ET

June S&P Futures: I expect the market to rally to 1285 over the next day or two. The 1261 level is support today. The drop from 1331 looks like only the first phase of a bigger three phase drop which will probably carry the S&P down to 1240 or so. After that I still expect a move to 1350 or higher.

June Bonds: The bonds are headed for support near 106-08. Over the next few weeks the market should reach the 110-111 zone.

June 10 Year Notes: The notes are headed for support at 105-00. Over the next few week I expect the market to rally into the 107-108 zone.  

Euro-US Dollar: The market traded about 40 pips above 128.40 resistance yesterday but I think a drop to 126.00 is now underway.

Dollar-Yen: The yen dropped to support near 111.00 yesterday and now should rally to 114.50. The market is preparing for a move up to 130.

July Crude: Resistance today is 71.20. A drop to 60.00 and below is underway.

June Gold: Gold should rally to 673 and then head downward once more. Downside target over the next few weeks is the 2 and 1/8 multiple of the 252 low which stands around the 535 level.

July Silver: Resistance today is at 1300. Silver will probably continue down to 1100 or so.

Google: I think Google will probably hold Friday’s low at 360 and rally to 410.

Monday, May 22, 2006

Advancing Issues


Here is a chart showing the daily count of the number of issues traded on the New York Stock Exchange that advance in price. The black line is the daily count, the pink line the 5 day moving average of the daily count, and the red line the 10 day moving average. I last commented on this indicator here.

As you can see the 5 day moving average has rallied from the low level it reached last week. On the basis of the advancing issues statistics cited in the last post on this subject a low in the S&P is a bit overdue but it could come as late as tomorrow and still be consistent with the recent historical record.

In any event you cans see a bullish divergence between the 5 day moving average and the S&P shaping up as the moving average has been moving higher while the S&P has been moving a little lower.

I would note too the level of the 10 day moving average, today (so far) at 1240. The lowest level it reached last October was 1260 and this happened right at the price low. In March 2005 this moving averager reached 1213 , a reading that was followed by a thirty point rally and then by a 50 point drop to lower price lows which were not confirmed by the 10 day moving average. In May 2004 this 10 day moving average dropped to 1151 just at the time when the S&P was about to begin a 70 point rally.

I think this indicator is telling us that a rally of 30 to 40 points in the S&P is imminent but that this rally will probably be followed by slightly lower lows which will not be confirmed by the advancing issues oscilators.

Rydex cash flow ratio

S&P Weekly


Here is a pair of charts which gives some perpective on the current position of the S&P 500 index.

The first chart above this post is a weekly chart of the cash S&P. It shows the last three substantial corrections within the current bull market. The first occurred from March through August of 2004 and carried the index down 102 points. The next two occurred during 2005 and carried the index down 93 and 78 points respectively.

The recent high was at the 1326 level. A drop of 78 points from there would end at 1248. A drop of 93 points would end at 1233. A drop of 102 points would end at 1224.

Thus far the index has dropped as low as 1256 and on this basis I think it fair to conclude that the correction that started from 1326 is much closer to its end than to its beginning.

The second chart above this post shows the Rydex cash flow ratio. This ratio is calculated and maintained by Decisionpoint.com and you have to pay $20 per month to access their site. (I for one think it is well worth the price.) I have discussed this ratio often on this blog, most recently here, here, and here.

A high value of the ratio tells us that short term traders are moving money out of stocks and into money market funds and funds which bet on declining stock prices. The scale on the chart you see is an inverted one so that high values of the ratio show up low on the chart.

Last Friday the daily value of the ratio reached its highest level of the past 6 years at 1.11. This shows that short term traders are very bearish and agressively betting on further drops from here. I think this is a very bullish situation.

The only thing that prevents me from looking for a move straight to 1350 from current levels is that the drop from 1326 does not yet show a clear three phase structure. So for the moment I expect a rally to a lower top and then a drop to a slightly lower low, probably near 1233 or 1224 in the cash index. Futures traders should remember that by the time this low develops (probably next month) the front contract will be the September contract. This contract will probably be trading about 10 points over cash at the low so the futures low will be more like 1243 or 1234.

US Dollar


Here is a daily bar chart of the US Dollar index.

In this previous post which discussed this same chart I projected that the third phase of a three phase correction in the dollar index would end near 87.00. In the event the dollar developed more weakness than expected. However, I do think that its recent low at 83.73 will hold and that the index will now head for the 99 level.

Among the reasons I am bullish on the dollar here is that the New York Times is bearish. Saturday the NYT's lead editorial was headed "Gambling on a Weaker Dollar". In it the Times expresses the view that dollar weakness is appropriate and should continue. They say that the weakening dollar won't hurt the economy as long as fiscal deficits are reduced. To achieve this they recommend raising taxes!!!! Yikes!! Only the NYT believes that the way to stimulate economic growth is to raise taxes.

In any case, the last time the NYT editorialized about the dollar was April 2, 2005. I discussed that editorial in this post. I think the NYT is an exquisitely bad market timer. So again I will fade the Times and say that the dollar will hit 100 before it drops below 80.

Guesstimates on May 22, 8:50 am ET

June S&P Futures: I expect the market to rally to 1285 over the next day or two. Meantime Friday’s low at 1258.25 should hold but if it doesn’t the worst I see on the downside is 1255. The drop from 1331 looks like only the first phase of a bigger three phase drop which will probably carry the S&P down to 1230 or so. After that I still expect a move to 1350 or higher.

June Bonds: The market is now headed for the 110-111 zone. Resistance today is at 107-24 and support over the next day or two will be found near 106-08.

June 10 Year Notes: The notes should now rally into the 107-108 zone. Resistance today is at 106-04..

Euro-US Dollar: The market should continue the rally from Friday’s low at 126.91 and reach the 128.40 level in a day or two.  After that another leg down should carry to 126.00.  

Dollar-Yen: I think the low at 108.96 will hold. The market is preparing for a move up to 130. Support over the next day or two is at 111.00.

July Crude: Switching to July crude today; July is trading 78 cents over June. Support in the July contract is near 67.50. A drop to 60.00 and below is underway.

June Gold: The market broke support at 665 on Friday and this means that a much more substantial drop is underway. Downside target over the next few weeks is the 2 and 1/8 multiple of the 252 low which stands around the 535 level.

July Silver: Silver will probably continue down to 1100 or so.

Google: I think Google will probably hold Friday’s low at 360 and rally to 410.

Friday, May 19, 2006

S&P 12:45 EDT


Here is a 15 minute chart of the June S&P futures. I discussed this chart earlier this morning.

Contrary to my expectation the market took out yesterday's low at 1261.50 but spent only about 7 minutes trading below that level. This new low at 1258.25 makes today's first hour high at 1270.00 the high of the last reaction on the way to the low. As you can see a few minutes ago the S&P's took out this high and this tells me that a three phase rally is underway.

My best guess now is that this rally will carry the market to 1295 or so over the next week.

S&P


Here is a 15 minute bar chart showing regular hours trading in the June S&P e-mini futures. I last commented on this chart near yesterday's close.

Yesterday the market opened with a gap upward, traded sideways for several hours, and then headed downward almost 20 points from the first hour high.

Today the market gapped upward again, traded sideways for 45 mintues, and then headed downward. But I think that this time the low (1261.50) will hold and that by early next week the S&P's will have rallied above the last rally high which is also yesterday's high. This will be the first phase of a three phase rally of 25-30 points.

T-bonds


Here is an hourly chart showing regular hours trading in the June t-bond futures. I last commented on this market here.

The market has broken decisively above the 107-00 level, the last rally high on the way down to the 105-11 low. This action breaks a long sequence of lower rally tops and as such is very bullish. The volume associated with this rally is increasing (as best seen in its moving average) but is not exceptionally high; this also bodes well for continuation upward.

As I have pointed out in this previous post the market is at a level from which a 4-5 point rally would be a normal expectation. So I conclude that the 105-11 low will hold for at least several weeks and that the bonds are headed up to 110 or so.

Guesstimates on May 22, 8:50 am ET

June S&P Futures: I expect the market to rally to 1285 over the next day or two. Meantime Friday’s low at 1258.25 should hold but if it doesn’t the worst I see on the downside is 1255. The drop from 1331 looks like only the first phase of a bigger three phase drop which will probably carry the S&P down to 1230 or so. After that I still expect a move to 1350 or higher.

June Bonds: The market is now headed for the 110-111 zone. Resistance today is at 107-24 and support over the next day or two will be found near 106-08.

June 10 Year Notes: The notes should now rally into the 107-108 zone. Resistance today is at 106-04..

Euro-US Dollar: The market should continue the rally from Friday’s low at 126.91 and reach the 128.40 level in a day or two.  After that another leg down should carry to 126.00.  

Dollar-Yen: I think the low at 108.96 will hold. The market is preparing for a move up to 130. Support over the next day or two is at 111.00.

July Crude: Switching to July crude today; July is trading 78 cents over June. Support in the July contract is near 67.50. A drop to 60.00 and below is underway.

June Gold: The market broke support at 665 on Friday and this means that a much more substantial drop is underway. Downside target over the next few weeks is the 2 and 1/8 multiple of the 252 low which stands around the 535 level.

July Silver: Silver will probably continue down to 1100 or so.

Google: I think Google will probably hold Friday’s low at 360 and rally to 410.

Thursday, May 18, 2006

S&P Update


Here is a 15 minute bar chart of the June S&P 500 futures. I commented on this market a couple of hours ago.

As you can see my 1266 target has been reached. After yesterday's volume climax subsequent lows have been associated with lower volume peaks. This is a sign that the selling pressure is abating. The second sign that selling pressure is abating is that today about 1300 issues on the NYSE are higher than the last close while yesterday only 588 issues managed this feat.

I think the S&P's are making a low here and are about to rally to 1300 or so.

S&P


Here is a five minute bar chart showing regular hours trading in the June S&P e-mini futures. I last commented on the S&P's here.

As I said in this morning's guesstimate the odds are that the market will take a peek below the 1268.25 low made after yesterday's close. But I think the market will hold above 1260 and then rally above 1290. This would be consistent with a very conservative interpretation the the 5 day moving average of the daily count of the number of advancing issues on the NYSE.

On the chart above I have drawn a horizontal line at the level of the last rally high on the way down to the 1268.25 low. A move above this line would be evidence that the 1268.25 low started a 25-30 point rally, especially if the breakout occurs on high volume. I think this is less likely then a quick visit below 1268.25 but it is important to be prepared for eventualities.

Above the Fold in the New York Times

As you know I place great emphasis in determining public attitudes towards markets and using this determination as a basis for a contrary approach. Here are my contrary opinion posts.

This morning the New York Times had a front page story on the stock market. It appeared "above the fold" and was headlined "Inflation Rising, Markets Tumble".

I want to point out that the last time the NYT had a front page story on the stock market was April 21, 2005. The story's headline was "Inflation Fears Pummel Stocks; New Lows for '05". Sound familiar?

On April 21, 2005 the S&P 500 closed at 1159.95. Yesterday's close was 1270.32. Two weeks ago the average was as high as 1325.

Draw your own conclusions.

NYSE Group


Here is a daily chart of the NYSE Group, the corporation that controls the New York Stock Exchange.

The all time high of NYX was 90.35. I think the market is completing the third phase of a three phase drop from that level. I see support at 56 which is the 5/8 multiple of that high. I think NYX will trade above 100 before the bull market in the averages is complete.

Board of Trade


Here is a daily chart of Chicago Board of Trade Holdings. I last commented on BOT here.

I have been generally bullish on BOT and did not expect the recent drop from the second top above the 130 level to go as far as it did. I do think that the market is now very near its low. Not only is is rapidly approaching its last important low of 85.05 (which I don't think will be broken) but it is even closer to strong support at 88, the 1 and 1/8 multiple of its all time low of 79.

Before the bull market in the averages is over I think BOT will reach the 150 level.

Chicago Merchantile Exchange


Here is daily chart of the Chicago Merchantile Exchange which has been one of the bull market leaders. I last commented on CME here.

I think a three phase correction from the 501 high is nearly complete. I see strong support near 435, just a tad below the 10 and 5/8 multiple of the all time low trade price of 41.35.

I don't think the bull market in CME is over yet. Later this year CME should rally up to my current longer term target of 542 which is the 13 and 1/8 mutiple of 41.35.

Sears Holdings


Here is a daily chart of Sears Holdings. I last commented on SHLD here.

Since the start of 2006 SHLD has been performing much more bullishly than the market has a whole. This pattern has continued during the recent break in the averages. As you can see SHLD today has reached the highest point of the move up from the 111.64 low and has hit my interim target of 154.

Since it is still outperforming the averages I think SHLD will go higher. My target now is the 1 and 5/8 multiple of the 111.64 low which stands near the 181 level. Meantime support should be found at 148.

New York Stock Exchange Advancing Issues


Here is a chart showing the daily count of the number of issues on the New York Stock Exchange that advance in price. The pink line is the 5 day moving average of this number. I last commented on this advancing issues indicator here.

At Tuesday's close the 5 day moving average dropped below the 1100 level. This is a fairly rare event and has happened only 10 times since 1999. On average an important price low has occurred between 3 and 4 trading days after the first drop below 1100. The range is 1 to 5 trading days.

Once the price low occurred the subsequent rally in the S&P 500 cash index avergaged 150 points, the median rally being 140 points. The smallest rally was 40 S&P points, the next smallest was 59 points.

I think a very conservative conclusion to draw from this analysis is that the S&P will make a low this week not far from my 1266 target and then will rally above 1300. In fact I think one would be justified in guessing that the subsequent rally will go much higher to 1400 or so. But I hesitate to draw this more optimistic conclusion yet because the drop from 1331 so far does not have a clear three phase look to it.

Guesstimates on May 18, 8:50 am ET

June S&P Futures: After the close yesterday the market dropped to 1268.25, not far from my 1266 target. I think it will go a bit lower today but I expect a rally back above 1290 to begin from this low. The drop from 1331 looks like only the first phase of a bigger three phase drop which will probably carry the S&P down to 1230 or so. After that I still expect a move to 1350 or higher.

June Bonds: The market made a higher low yesterday and will now move up to 106-26. Strength above 107 would have very bullish implications.

June 10 Year Notes: The notes should rally to 105-18 and more strength than that would have very bullish implications.

Euro-US Dollar: The market found support yesterday at 127.00 and has since rallied to 127.88. I don’t think the drop from 129.70 is over and resistance today is at 128.00.

Dollar-Yen: The yen moved well above the key 110.81 level yesterday so I think the low at 108.96 will hold. The market is preparing for a move up to 130.

June Crude: The market made a second consecutive lower top last week and now should drop to 66.50 on its way below 60.00.

June Gold: The market should drop to 665 or so and from that point another rally should start.

July Silver: Silver will probably continue down to 1100 or so.

Google: Google should drop further to 356 and then start a big rally.

Wednesday, May 17, 2006

S&P 3pm EDT update


Here is a 1 minute chart showing trading in the June S&P futures. I commented on the S&P earlier today here and here.

The market has broken below temporary support at 1274. Volume is quite a bit lower than on this mornings' break and I am willing to make an educated guess that another rally to the 1280 level is about to start.

However, I think we will see 1266 soon, maybe even tomorrow. If I am right about this I would have to conclude that the break from 1331 to 1266 was only the first phase of a three phase drop. If so I think the total drop from 1331 after all three phases are complete would be 75-100 points, comparable to the biggest drops we have seen during the bull market.

Dollar-yen


Here is an hourly chart of the cash dollar-yen pair. I last commented on this market here.

I think the low for the move down from the 121.38 level last December has been made. I think the market will soon move above 110.85 and this would be strong evidence that the low is in fact in place. I think the yen is about to embark on a move to the 130 level.

Euro-USD


Here is an hourly chart showing trading in the Euro-US dollar pair. I last commented on this market here.

I think a three phase drop to 126.50 is underway. Any substantial weakness below 126.50 will mean that the market is headed below 116. In fact, I think this is a more likely development than a move above 130.

S&P 12 noon EDT update


Here is an updated 15 minute chart of the June S&P futures. I last commented on this chart a short while ago.

The market has reached temporary support at 1274 on what appears to be a volume climax. A rally to 1289 or so should be the next development. I think that after this rally the market will drop to 1266 or so on lower volume than we have seen on the drop from 1301, yesterday's high.

hourly chart of July silver futures

Silver

Here is an hourly chart showing pit and electronic trading in July silver futures. (Ignore the big vertical lines on the chart - they are the result of data transmission errors.) I last commented on silver here.

I have been looking for a drop in silver to 1210 but I now think a more reasonable target for a three phase reaction is roughly 1100. This is the 3 and 1/8 multiple of the 351 low of 1991 and should be strong support.

So far the high in silver has been 1520. This is closer to the 3 and 3/8 mutiple of the 351 low than anything else, and for this reason I think the market has a good chance of moving up further to the much stronger resistance around the 1620 level which is the 3 and 5/8 mutiple of 351. If this view is correct I don't think the market will drop much below 1100.

hourly chart of June gold futures

Gold

Here is an hourly chart showing pit and electronic trading in June gold futures. (Ignore the two big vertical lines in the middle of the chart - they are just data transmission errors.) I last commented on gold here.

I think the market has entered the third phase of a three phase decline. If so the downside target will be 665 which is just above 661, the 2 and 5/8 multiple of the 1999 low at 252.

At this juncture I think a three phase corrective move downward is more likely than the start of a bear market. The reason is simple.

The market bounced of resistance near 725 which was the 2 and 7/8 multiple of the 252 low. In my experience the 3/8 and 7/8 mulitples generally do not end bull markets, so I am looking for another leg up to the 3 and 1/8 multiple of 252 which stands near 788. The only thing that would make me reconsider this view would be a substantial and accelerating drop below the 660 level

15 minute chart of June S&P futures

S&P

Here is a 15 minute bar chart showing regular hours trading in the June S&P e-mini futures. I last commented on the S&P's here.

In this morning's guesstimate I said that the decisive break of the 1290 level on the CPI news told me that the market was headed for 1274, not 1306 as I thought yesterday. After the open you can see the very high volume of trading and I think this confirms that the path of least resistance is now downward.

Once the market reaches 1274 I would expect a rally of about 15 points, about equal in length to the rally from Monday's overnight low to Tuesday's high. I still expect to see this market trade in the 1265-70 zone before an advance to 1350 can begin.

Guesstimates on May 17, 8:50 am ET

June S&P Futures: The market has dropped well below 1290 support early this morning so I must conclude that it about to take another step down, this time to 1274 or so. I expect to see a rally from that level before the downside target in the 1265-70 range is reached.

June Bonds: A move down to 104-20 or so from resistance at 106-14 has begun.

June 10 Year Notes: A move down to 104-04 or so from resistance at 105-06 has begun.

Euro-US Dollar: The market moved a little above 128.90 resistance overnight but the rally from yesterday’s low has been a slow one relative to recent rallies. Since the drop from the 129.70 high still does not have a three stage look to it I think the next important move will be downward to 126.50.

Dollar-Yen: The market is trading sideways in preparation for a big move up. A rally over the 111.50 level would tell me that this advance has begun. Today the 108.80 level is support.

June Crude: The  market made a second consecutive lower top last week and now should drop to 66.50 on its way below 60.00.

June Gold: The rally from 675 should not go above resistance which today stands at 720. The next downside target is 665.

July Silver: Silver broke back below support at 1440 and will now probably continue down to 1210 or so. Resistance today is at 1405.

Google: Google should drop further to 356 and then start a big rally.

Tuesday, May 16, 2006

S&P Update


Here is an updated five minute bar chart of the June S&P e-minis. I commented on this chart earlier today.

The rally from the day's low at 1291.50 went a bit further and lasted longer than I expected but I still think the odds are good that we will see a 1290 print before another rally gets underway. A move to 1306 is then likely but once it is complete look for a drop to 1266 or so.

Bonds


Here is an hourly chart of regular hours trading in the June T-bond futures.

As I pointed out in my last post on the bonds I think this market is very near an important low, possibly the low of the entire drop from the 119-23 top of June 2005. However, there is still no sign based on market action that this low is in place.

The hourly chart you see above this post shows the swings within this bond downtrend from 115-05 in January 2006 in the June contract. The last two big rallies were 44 and 39 ticks in length. The current rally started from and overnight low of 105-11 (not shown on the chart) and has carried the market 37 ticks upward so far. I think we are headed back down from here and the risk on the upside is no more that 7 ticks to 106-23.

The most bullish thing that could happen would be a continuation of this rally above the 107-00 level of the last top. While I don't think this will happen on this swing, such a development would force me to conclude that the 105-11 low has started a rally of at least 5 points or so.

S&P


Here is a five minute bar chart showing regular hours trading in the June S&P futures. I last commented on this chart here.

The market couldn't follow through on its rally over the 1299 level and has dropped about 10 points from its high reached a little after today's open. The whole move up from the 1285.25 overnight low (not shown on this chart) was a three phase rally, but I think it was itself only the first phase of a somewhat bigger upmove. I originally thought this bigger move would reach the 1310-15 zone but today's break causes me to lower the target to 1306.

I think the break from today's high at 1301.50 will itself develop in three phases. The first looks complete to me and we should now see a brief rally into the 1297-98 zone. Then expect another drop to 1290 or so which should complete the move down from 1301.50. Finally from the 1290 low I think another rally, this time to 1306, will develop.

I still expect a drop from 1306 to 1266 or so which will complete the entire corrective phase from the 1331.25 high earlier this month.

Google


Here is an daily chart of Google. I last commented on GOOG here.

GOOG has not bounced off of what I thought would be support around 372 very vigorously. This together with my slightly bearish short term outlook for the averages leads me to conclude that GOOG will head lower before beginning another big rally. My target now is 356

Baidu


Here is a daily chart of Baidu.com. I last commented on Baidu here.

The market has rallied from support at 77 and reached resistance at 87. I think the third phase of the correction from 91 is about to begin. Upon reflection I have decided to raise my estimate of support and the target for the third phase low to 69 from 65.

Guesstimates on May 16, 8:50 am ET

June S&P Futures: The market has dropped 46 points from its 1331.25 high making this reaction so far equal in length to the January-February break. However we clearly have seen only the first phase of a three phase reaction. A rally into the 1310-1315 range is now underway and is the second phase of this correction. After the second phase top the third phase will carry the market down into the 1265-70 range.

June Bonds: Resistance today is at 106-14 and I expect the market to drop to 104-20 before a multi-point rally starts.

June 10 Year Notes: Resistance today is 105-06 and I expect the market to drop to 104-04 before a multi-point rally starts.

Euro-US Dollar: Resistance above the market today stands at 128.90. The market broke sharply from its 129.70 high yesterday and took out the last low on the way up which stood at 128.53. This together with the fact this the drop from 129.70 was bigger than any other drop during the past month implies that the market will probably drop at least 300-500 pips from 129.70.

Dollar-Yen: The market is trading sideways in preparation for a big move up. A rally over the 111.50 level would tell me that this advance has begun. Today the 109.70 level is support.

June Crude: The market made a second consecutive lower top last week and now should drop to 66.50 on its way below 60.00.

June Gold: The market has broken the last low on the way up to its 732 high so will probably drop in a three phase reaction to 665 or so. Resistance today is at 705.

July Silver: Silver broke back below support at 1440 and will now probably continue down to 1210 or so. Resistance today is at 1420.

Google: Google has reached my third phase target at 372 and I am expecting the market to make a low near here and then head up to new highs.

Monday, May 15, 2006

S&P Update


Here is an updated version of the five minute bar chart which I discussed this morning.

I think the S&P is on its way above the 1299 level and this will confirm the start of a move into the 1310-15 range. The expected rally will be only the second phase of what I think will be a three phase correction. I expect the third phase to carry the market down from the 1310-15 zone to 1265 or so.

Dollar Yen


Here is a weekly chart of the cash dollar-yen pair.

I have drawn lines that show the multiples of the all time low price of 79.80 which was reached in April of 1995.

I think the dollar-yen has completed a move down from the 121.38 high reached last December 4. It has stopped at the 1 and 3/8 multiple of the 79.80 low which stands at 109.72. I would expect a low around here because the more important low of January 2005 occurred at 101.67. The 1 and 1/4 multiple of the 79.80 low is 99.75 and so I would expect the next low to occur at the 1 and 3/8 mutiple because I think the yen is headed much higher.

The next important upside target for the yen is the 1 5/8 mutiple of 79.80 which is 129.67.

S&P


Here is a 5 minute bar chart showing regular hours trading in the June S&P e-mini futures. I last commented on this chart Friday.

You can see that the market has dropped in an amazingly long series of lower lows and lower highs. After such a long, regular decline the first break above a previous reaction high generally means that a new trend in the opposite direction has started. This is what I expect to happen today.

Overnight the market dropped as low as 1285.25. After the open it rallied as high as 1295.50. I think we will see another drop to 1285 or so and then a rally above 1296 today.

The subsequent move up should carry into the 1310-15 zone and will constitute the second phase of a three phase drop from 1331.25. I expect the third phase to carry from 1310-15 down to 1265 or so. After the third phase low I think the market will move up to 1350 or even higher.

Guesstimates on May 15, 8:50 am ET

June S&P Futures: The market has dropped 46 points from its 1331.25 high making this reaction so far equal in length to the January-February break.  However we clearly have seen only the first phase of a three phase reaction. From this I conclude that a rally into the 1310-1315 range is now likely as the second phase and that a third phase will carry the market down into the 1265-70 range.

June Bonds: Resistance today is at 105-28 and I expect the market to drop to 104-20 before a significant rally starts.

June 10 Year Notes: Resistance today is 104-30 and I expect the market to drop to 104-04 before a significant rally starts.

Euro-US Dollar: The market has broken sharply from its overnight high of 129.70 and has taken out the last low on the way up which stood at 128.53. This together with the fact this the drop from 129.70 so far is bigger than any other drop during the past month implies that the market will probably drop at least 300-500 pips from today’s top.

Dollar-Yen: The market is trading sideways in preparation for a big move up. A rally over the 111.50 level would tell me that this advance has begun.

June Crude: The  market made a second consecutive lower top last week and now should drop to 66.50 on its way below 60.00.

June Gold: The market has broken the last low on the way up to its 732 high so will probably drop in a three phase reaction to 665 or so.

July Silver: Silver broke back below support at 1440 and will now probably continue down to 1210 or so.

Google: Google has reached my third phase target at 372 and I am expecting the market to make a low near here and then head up to new highs.  

Friday, May 12, 2006

Baidu Update


Here is a daily chart of Baidu.com. I commented on this chart yesterday.

In my last post on BIDU I said that if the market were to reach 77 support without any intervening reaction then I would identify the drop from 91 as only the first phase of a three phase corrective move. This is in fact what has happened as you can see from the chart. So now I think the market will rally to 87 or so and then decline in a third phase to support around the 65 level.

I still think BIDU has a good chance to move over the 100 level after this correction is complete.

Bonds


Here are two charts showing price action in the t-bond futures. The first chart above this post is an hourly chart showing regular hours trading in the June t-bond futures. The second chart is a weekly continuation chart showing trading in the bond futures since the high in June 2003 around the 124 level in the front month at the time.

As you can see from the hourly chart the market has shown a steady and very long sequenc of lower highs and lower lows since its high in January at 115-05 in the June contract. Until this sequence is broken I have no reason to think a rally of more than a point or two is likely.

On the other hand looking at the weekly chart we see that we can project a drop from the January top of 115-05 in two ways.

The first one is illustrated by the red lines. I had commented on this projection in this earlier post. If the drop from 115-05 had equalled the drop from the August 2005 top at 118 to the November 2005 low at 110 it would end 8 points below 115-05, i.e. at 107 or so. This level has clearly been broken.

The second calculation is illustrated by the green lines. If the drop from 115-05 were to equal the drop from the June 2005 top near 120 to the November 2005 low near 110 it would be nearly 10 points and end near 105-16 or so. The market has reached that level today and I think this justifies putting more than ususal weight on any short term bullish indication.

In my 2006 bond market forecast I said that the yield on the 10 year notes would make it up to the 5.20% level sometime in the August-September 2006 time frame. So far the yield has reached 5.19%. I also predicted that the yield on three month t-bill would reach 4.95% sometime during the fourth quarter of this year. So far the bills have reached the 4.76% level.

Without worrying too much about exact timing or exact projections for the peak in rates I will say that I do think the interest rate markets are very near their peak yields for this cycle and I do think that the next substantial move in yields from here will be downward. Of course this means that the next big move in bond prices from here will be upward.