
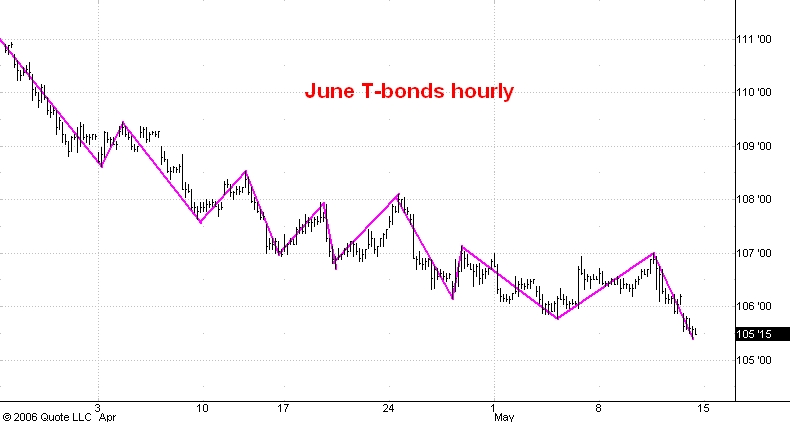
Here are two charts showing price action in the t-bond futures. The first chart above this post is an hourly chart showing regular hours trading in the June t-bond futures. The second chart is a weekly continuation chart showing trading in the bond futures since the high in June 2003 around the 124 level in the front month at the time.
As you can see from the hourly chart the market has shown a steady and very long sequenc of lower highs and lower lows since its high in January at 115-05 in the June contract. Until this sequence is broken I have no reason to think a rally of more than a point or two is likely.
On the other hand looking at the weekly chart we see that we can project a drop from the January top of 115-05 in two ways.
The first one is illustrated by the red lines. I had commented on this projection in this earlier post. If the drop from 115-05 had equalled the drop from the August 2005 top at 118 to the November 2005 low at 110 it would end 8 points below 115-05, i.e. at 107 or so. This level has clearly been broken.
The second calculation is illustrated by the green lines. If the drop from 115-05 were to equal the drop from the June 2005 top near 120 to the November 2005 low near 110 it would be nearly 10 points and end near 105-16 or so. The market has reached that level today and I think this justifies putting more than ususal weight on any short term bullish indication.
In my 2006 bond market forecast I said that the yield on the 10 year notes would make it up to the 5.20% level sometime in the August-September 2006 time frame. So far the yield has reached 5.19%. I also predicted that the yield on three month t-bill would reach 4.95% sometime during the fourth quarter of this year. So far the bills have reached the 4.76% level.
Without worrying too much about exact timing or exact projections for the peak in rates I will say that I do think the interest rate markets are very near their peak yields for this cycle and I do think that the next substantial move in yields from here will be downward. Of course this means that the next big move in bond prices from here will be upward.