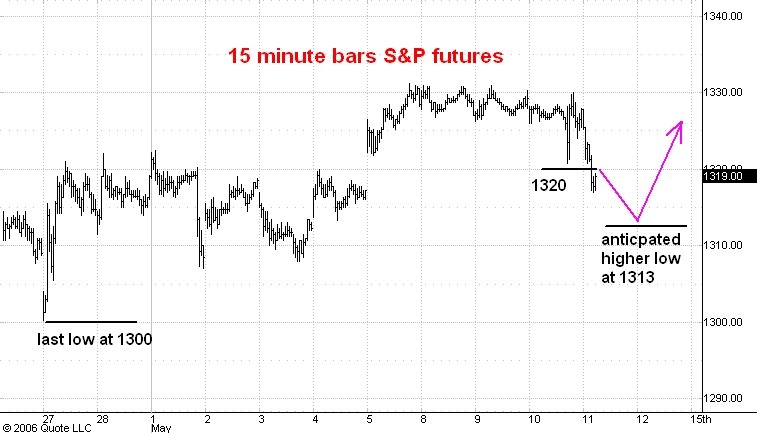
Here is a 15 minute bar chart showing regular hours trading in the June S&P e-mini futures. I last commented on this chart here.
This morning the market broke support at the 1320 level. The drop from 1331 already has a three phase shape and since I am bullish on stock prices I am anticipating a higher low around the 1313 level. From there we should see the start of a rally to 1350.
No comments:
Post a Comment