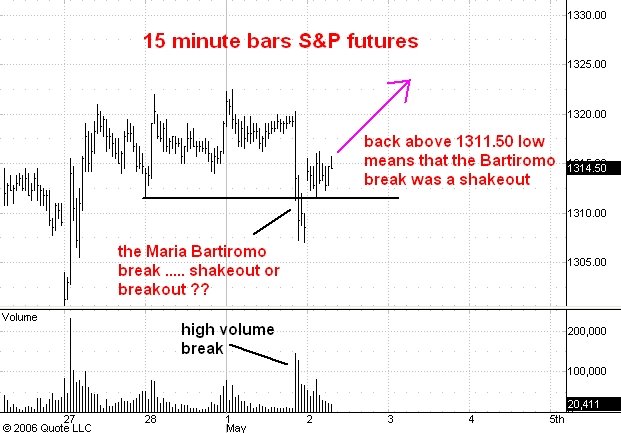
Here is a 15 minute chart showing regular hours trading in the June S&P e-mini futures. I last commented on this chart here.
The S&P's have spent the entire pit session so far today trading above the 1311.50 level which is the "shakeout low" associated with the black horizontal line on the chart. This sort of action generally means that the market is "rejecting" the prices below this line and implies that higher prices should be seen today and tomorrow.
I think that the market is on its way to 1350 and if I am right we should see a move above the 1316 level on increasing volume today.
1 comment:
Carl:
why do you think NAZ is lagging this entire move. i do remember that you had mentioned NAZ could be at 2600-2900 before the rally ends. just wondeirng why it is lagging.
Post a Comment