Here is an hourly chart of regular hours trading in the June T-bond futures.
As I pointed out in my last post on the bonds I think this market is very near an important low, possibly the low of the entire drop from the 119-23 top of June 2005. However, there is still no sign based on market action that this low is in place.
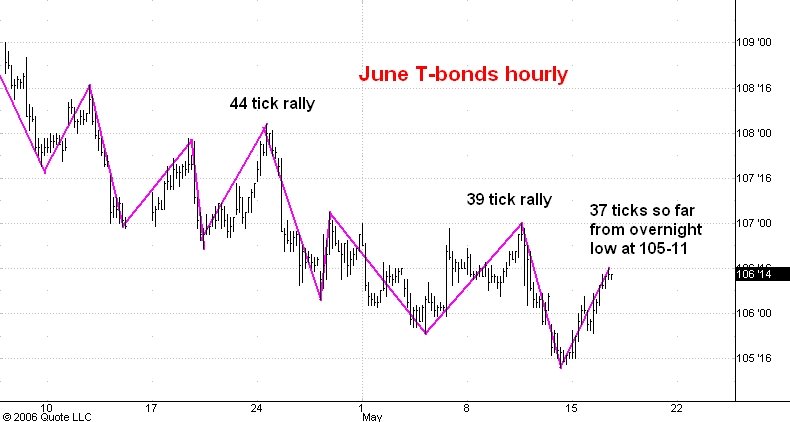
The hourly chart you see above this post shows the swings within this bond downtrend from 115-05 in January 2006 in the June contract. The last two big rallies were 44 and 39 ticks in length. The current rally started from and overnight low of 105-11 (not shown on the chart) and has carried the market 37 ticks upward so far. I think we are headed back down from here and the risk on the upside is no more that 7 ticks to 106-23.
The most bullish thing that could happen would be a continuation of this rally above the 107-00 level of the last top. While I don't think this will happen on this swing, such a development would force me to conclude that the 105-11 low has started a rally of at least 5 points or so.
No comments:
Post a Comment