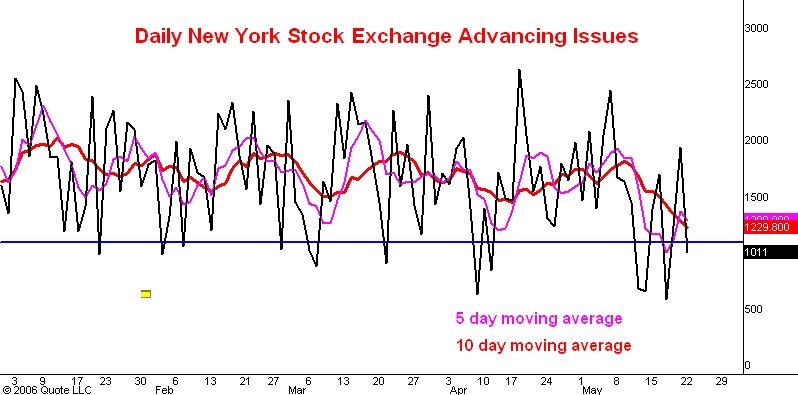
Here is a chart showing the daily count of the number of issues traded on the New York Stock Exchange that advance in price. The black line is the daily count, the pink line the 5 day moving average of the daily count, and the red line the 10 day moving average. I last commented on this indicator here.
As you can see the 5 day moving average has rallied from the low level it reached last week. On the basis of the advancing issues statistics cited in the last post on this subject a low in the S&P is a bit overdue but it could come as late as tomorrow and still be consistent with the recent historical record.
In any event you cans see a bullish divergence between the 5 day moving average and the S&P shaping up as the moving average has been moving higher while the S&P has been moving a little lower.
I would note too the level of the 10 day moving average, today (so far) at 1240. The lowest level it reached last October was 1260 and this happened right at the price low. In March 2005 this moving averager reached 1213 , a reading that was followed by a thirty point rally and then by a 50 point drop to lower price lows which were not confirmed by the 10 day moving average. In May 2004 this 10 day moving average dropped to 1151 just at the time when the S&P was about to begin a 70 point rally.
I think this indicator is telling us that a rally of 30 to 40 points in the S&P is imminent but that this rally will probably be followed by slightly lower lows which will not be confirmed by the advancing issues oscilators.
No comments:
Post a Comment