Wednesday, August 31, 2005

Advancing Issues Update


Here is an update to my last post 45 minutes ago. The market continued to rally during that time and today's count of the number of issues advancing in price on the New York Stock Exchange was higher than anytime during the past three months (red line on the chart above). Coming in the context of a bullish divergence this is incredibly bullish action.

Advancing Issues Breakout


There is still 45 minutes left until floor trading on the New York Stock Exchange halts for the day. Even so, I thought I would alert you to the behavior of the daily count of the number of issues advancing in price on the NYSE. This is the chart you see above this post.

Evidently this indicator will have broken above its high points of the past two week (dashed line) as well as above its highs of the past month (solid line) by the close of trading today. In the light of the ongoing divergence I last discussed here, this is very bullish action. The stock market in the USA is headed much higher from here.

Eurodollars


Here is a daily chart of the March 2006, 3 month eurodollar futures. I've drawn in the bear market boxes I have been using for the past 18 months for all the 3 month eurodollar contracts.

As you can see eurodollar traders seem to be anticipating a halt to the Fed's policy of steady, quarter point increases in the Fed funds rate. The market has really taken off the past couple of days and I think Katrina had more than a little to do with this.

In any case you can see that the market is approaching the 1/2 point of its current box near 95.97. I think this is a minimum target for this rally and I think a continuation up to the top of the box near 96.20 is a least an even money bet.

But the bear market is not over. As I said in my 2005 bond market forecast, any pause by the Fed will end once people start to see a very strong economy in 2006. I think next year will be a bearish one for the bond market in general and I think we will see cash 3 month eurodollars trading at 4.75% by the end of 2006. This would probably mean that the futures will drop below 95.00 sometime next year.

Chicago Merchantile Exchange A


Here is an updated daily chart of Chicago Merchantile Exchange A stock.

As you can see the market has been resting on the 1/2 point of its current box. I think it will rally with the averages and move up to the top of the next box at 363. My bull market target is still 411.

Sears Holdings


Sears holdings has dropped quite a bit more than I had expected. Apparently the combination of high gasoline prices and worries about a slowing economy have hurt the entire retail sector.

Even so, this is a bull market and I think the economy will be even stronger in 2006 than it is now. I think that SHLD will move above its 162 top but will probably not reach my original 252 target because it has started to underperform the market averages a bit.

The low of the current drop from 161 will occur near the bottom of the current box near 130 and SHLD will rally to new highs from there.

IBM


Here is an updated daily chart of IBM. The market has reacted about a box from its July 19 top near 85 and is now resting at the 1/2 point of its current box. I am bullish on the averages and I think IBM will move up with the general market. My bull market target for IBM is 106.

Bonds and Notes


As you can see from the updated hourly charts above, the September bond and 10 year note futures have rallied relentlessly ever since their lows on August 9. It is quite unusual for any market to move upward for three weeks without a significant break of a previous day's low. But this is what we have seen in the bonds and notes. It is an eye-popping show of strength and is one more piece of evidence that the bonds are headed for the 121-123 zone and the notes for 116

I notice that the short end of the market is strong too so I am beginning to think that bond traders are anticipating a pause in the Fed's string of interest rate increases, perhaps in response to the economic damage caused by Katrina.

The bonds are now likely to react a box or so from the 1/2 point of the current box at 118-20 and the notes will also react a box or so from the top of the current box at 113-04.

Guesstimates on August 31, 8:55 am ET

S&P Futures: A rally to 1268 has begun.  Support today is at 1202.

Bonds: The 117-30 level is resistance and I think the bonds will drop a box or so from there. The market will then resume its rally into the 121-123 zone.  

10 Year Notes: Resistance today is 112-22 and the notes will then drop a box or so before resuming the move up to 116.

Eurocurrency: The market will hold support at 121.70 and then rally to 125.60.  

October Crude: There is very strong resistance in the 70.00 to 70.50 zone and I think the market will drop below 66.00 in a few days.

December Gold: The market should hold the 436 level, the bottom of its current box.  The next step up will carry to 468.      

Google: 272 is support; the next move up will reach 343.  

Tuesday, August 30, 2005

Bonds and Notes


Here are updated hourly charts of pit trading in the September bond and 1o year note futures.

I had been anticipating a reaction of about a box in each market but instead both markets continue to move higher. This show of strength give me even more confidence that the bonds are headed for the 121-123 range and the notes to 116 over the next couple of months.

Right now I think the bonds will begin a reaction of about a box from the top of the current box near 117-30. The notes will probably start their reaction from the 1/2 level of the current box near 112-22.

S&P


Here is a compressed and updated hourly chart of pit trading in the September S&P futures going back to early July.

The first low you see on the chart was the low that occurred on July 7 right after the London terrorist attack. The news itself came very early in the morning New York time and in electronic trading the market dropped to 1167 (the first blue line on the chart). When pit trading started in Chicago that morning the market traded at 1186.50 and went up from there. The drop from the preceeding high at 1225.20 on June 17 to the July 7 low was 58 points.

I like to use precedents such as this one to get a handle on the likely terminal points of trends. In the current situation the market made another high at 1249.20 on July 29. Another drop of 58 points would carry to 1191. The low Sunday night after the hurricane news was 1194.20.

This gives me quite a bit of confidence that 1194 was the low of the current reaction.

The second factor which reinforces this deduction is that as an uptrend progresses low points occur at successively higher box levels. The July low occurred at the low point of the current box near 1180. So it makes sense to expect that the current reaction would end at the next higher box level, i.e. the 1/2 point of the current box near 1202.

Eurocurrency


Here are updated daily and hourly charts of the September eurocurrency futures.

I still think that the market will rally to roughly 126.70. This is the top of the second rally box on the daily chart and just below the top of the current bear market box.

On the hourly chart you can see that the market has again hit the bottom of its current short term box and I think that it is now headed upward. The 125.70 level is the top of the next higher short term box and this seems like a reasonable short term target.

Crude Oil at 11am ET


The markets seem to be dancing to crude oil's tune so I thought you might like to see an updated hourly chart of October crude oil.

Near the close of pit trading yesterday the market dropped to the bottom of its box at 66.30 and rallied. This morning I thought that it would stop at the top of the corresponding box at 68.20, but as you can see this didn't happen. Instead October crude rallied all the way to the pair of very strong resistance levels near $70 : the top of the long term box at 70.40 and the top of the trading box near 70.10.

I think prices will drop from here and will soon be below 66.00.

Guesstimates on August 30, 8:45 am ET

S&P Futures: A rally to 1268 has begun. Support today is at 1202.

Bonds: I think the bonds will drop to 115-28. From there the market will resume its
rally into the 121-123 zone.

10 Year Notes: Resistance today is still 111-31 and the notes will then drop to 110-30 before the rally resumes.

Eurocurrency: The market has dropped back to support at 121.70. I think this level will hold and that a move up to 125.60 will begin.

October Crude: The market rallied off of the low of a box at 66.30 late yesterday and now has reached the top of a box at 68.20. I think it will turn down from here and drop to the bottom of the next lower box at 64.40.

December Gold: The market broke below support at 442 last night but should hold the 436 level, the bottom of its current box. The next step up will carry to 468.

Google: 272 is support; the next move up will reach 343.

Monday, August 29, 2005

NYSE Advancing Issues


As I have noted here, here and here, the S&P decline from its top at 1248 has recently been accompanied by divergent behavior in the daily number of issues which advance in price on the New York Stock Exchange.

I have updated this information in the charts above. Today the averages again made new reaction lows, but the daily number of advancing issues and both its 5 and its 10 day moving averages stayed above the lowest points seen during the drop from 1248. This indicates that the market has gradually been strengthening despite the drop in the averages during the past 10 days. This coupled with the fact that the S&P futures today bounced off of the 1/2 point of their short term box means that the short term trend has once again turned upward.

I think the market is now headed for 1268.

Crude Oil at 1pm ET


Here is a chart of October crude oil at 1pm ET.

The market has broken below a box boundary around 68.20 and is now headed for the bottom of its current box near 66.30. Within a few days it should go much lower than that.

Gold


Here is an hourly chart of December gold which shows both pit and electronic trading.

The market has been resting at the bottom of its current box near 442 for the past week. Soon it will start a rally to the top of the next higher box around 470.

S&P


Here is an updated hourly chart of pit trading in the September S&P futures. Last night the market dropped as low as 1194.20 in electronic trading but as you can see it opened this morning in Chicago right at the 1/2 point of its current box at 1202.

I think the market has begun an uptrend which will carry it to the top of the next box around 1268, and eventually much higher than that.

Crude Oil at 9am ET


I thought you might like to see an updated hourly chart of October crude oil futures before pit trading starts in New York today.

The market surged to 70.80 just after electronic trading began last night. This was the immediate response to the hurricane Katrina news - this storm is expected to cause major damage to New Orleans and the Gulf coast - including oil production and refining facilities.

My inclination is always to fade news that sends the market to important support or resistance levels and this instance is no exception. As you can see from the chart the market has reached the top of its long term box as well as the top of its short term box. (Ignore the big price bar at the left of the chart - this resulted from a garbled electronic tranmission of price data.)

I think the market is at a decisive long term turning point for other reasons as well. Among them are excessive levels of bullish sentiment as manifest in recent cover stories in the New York Times and in The Economist magazine.

Guesstimates on August 29, 8:45 am ET

S&P Futures: The hurricane news sent the market to 1194, below the 1/2 point of the current box at 1202. I think this is an overreaction to the news and that the S&P will finish the day above 1202. A rally to 1268 will start soon.

Bonds: I think the bonds will again close below 116-30 resistance today and then drop to 115-28. From there the market will rally into the 121-123 zone.

10 Year Notes: Resistance today is still 111-31 and the notes will then drop to 110-30 before the rally resumes.

Eurocurrency: The market has held support at 121.70 and is now on its way to 125.60.

October Crude: The hurricane news sent crude to 70.80 overnight, right at the top of its long term box as well as at the top of another short term box. The market is going down big from here.

Gold: Support is at 442 and the next step up will carry to 463.

Google: 272 is support; the next move up will reach 343.

Saturday, August 27, 2005

Oiloholics


Here is a link to the most recent cover story in The Economist newsweekly.

The cover depicts the USA and China as "drunk" on oil. Rising oil prices are a problem according to The Economist. They also assert that high oil prices are the Fed's fault because the Fed reflated the US economy after the 2000-2002 stock market crash. Evidently The Economist shares with many other elite commentators an aversion to economic growth, especially if it comes in the USA. No surprise then that they conclude the solution is that the USA should raise gasoline taxes to European levels (or beyond) !!!

I think this cover story is another sign that the bull market in crude oil is over. Here is another.

Look out below !!

Bad Mouthing Baidu

Here is a link to a column by John Shinal on MarketWatch.com.

To be fair, he is not just bad mouthing Baidu the company but also the whole IPO process for dot com shares. This is just another manifestation of opinion leaders' negativity towards tech IPO's and their profit potential.

I still haven't heard anyone say good things about Baidu on the Street, so I am still sticking with my 270 upside target (subject to revision according to these considerations). Here is my previous post on Baidu.

Friday, August 26, 2005

Crude Oil


I have been trying to pick the short term top in October crude oil, so far without much success.

Here is an updated hourly chart. Ignore the big spike that appears in the upper part of the chart because is just the result of bad quote transmission.

As you can see the market has been trading around both sides of the 1/2 point of the current box near 67.20 and now is headed for the top of the box near 68.20. Notice that in overnight trading a few days ago the market actually traded briefly at 68.00. I expect a peek above 68.00 and then a big break.

The other thing worth remembering is that crude is very close to the top (blue line) of its second long term box at 70.40. This is one reason (among several) that I am long term bearish on crude.

Bonds and Notes


Here are the updated hourly chart of the September t-bond futures and 10 year note futures.

Both markets are in uptrends which began from lows on August 9. Over the next couple of months I expect the bonds to move into the 121-123 zone and the notes to reach the 116 level.

Predicting temporary highs in an uptrend is difficult business as my efforts in the bonds and notes over the past week have illustrated. I am still working with the boxes defined in the last downtrend since they still seem to be controlling both markets' fluctuations.

As you can see in these charts the bonds this morning have reached the 1/2 point of the current box while the notes have been trading a bit above their correpsonding 1/2 points for the past couple of days. I have other reasons for thinking both markets will start reactions of at least a box from this morning's highs. If I am wrong about this then the most I see before such a reaction begins is a rally to the top of the current boxes in both markets.

Guesstimates on August 26, 8:50 am ET

S&P Futures: The 1/2 point of the current box at 1202 is now support and from there I think the marketwill start a rally to 1268. Meantime resitance is at 1220.

Bonds: 116-30 is still resistance today and from there the market will drop to 115-04 before resuming the rally into the 121-123 zone.

10 Year Notes: Resistance today is still 111-31 and the notes will then drop to 110-30 before the rally resumes.

Eurocurrency: The market has held supuport at 121.70 and is now on its way to 125.60.

October Crude: The market will hold resistance at 67.40 and begin a drop to 60.50.

Gold: Support is at 444 and the next step up will carry to 463.

Google: 272 is support; the next move up will reach 343.

Thursday, August 25, 2005

S&P Rallies


In yesterday's S&P post I said that the market would now drop to the 1/2 point of its current box near 1202 before the move up to 1268 can begin.

In the meantime it can be helpful to visualize the extent of any rally that might occur before the 1202 level is reached.

There are two methods I use to estimate the extent of likely reactions against the trend. The first is my box theory. In the case of the S&P move down from 1248 I estimate that the short term trading boxes for this drop are 12 points wide, but I have not drawn them on the hourly chart above to avoid confusion. In any case, a normal reaction against the trend is generally a box in length so a rally from 1209 should carry no further than 1221.

The second method I use as a check on my box theory calculations is to look at the extent of previous reactions in the same trend. In this case I have identified 4 previous rallies in this downtrend and marked them by solid blue lines on the hourly chart. These 4 rallies moved the market up anywhere from 10 to 13 points. So a rally from 1209 on this basis would end anywhere from 1219 to 1222.

My point is that a rally into the 1219-1222 zone would be normal and would not mean that the move down from 1248 is over.

If I thought that this drop would go much further than 1202 then I would look to sell in the 1219-1222 zone.

Guesstimates on August 25, 8:45 am ET

S&P Futures: The 1/2 point of the current box at 1202 is now support and from there I think the marketwill start a rally to 1268.

Bonds: 116-30 is still resistance today and from there the market will drop to 115-04 before resuming the rally into the 121-123 zone.

10 Year Notes: Resistance today is still 111-31 and the notes will then drop to 110-30 before the rally resumes.

Eurocurrency: The market has held support at 121.70 and is now on its way to 125.60.

October Crude: The market will hold resistance at 67.40 and begin a drop to 60.50.

Gold: Support is at 444 and the next step up will carry to 463.

Google: 272 is support; the next move up will reach 343.

Wednesday, August 24, 2005

S&P


During the last hour the September S&P futures broke decisively below what I thought would be support at 1217. This means that the market is headed for the 1/2 point of its current box near 1202. The advancing issues divergences which I discussed yesterday are still intact and I still believe that the next big move from here will be upwards.

Crude Oil


This morning crude oil was tested by the weekly release of the inventory numbers. As you can see in the hourly chart of October Crude above the market zigged and zagged a bit on the news but basically seemed indifferent. Then later in the day it moved decisively above the top of its most recent box. I still think this market is headed for a big break soon but meantime it will rally to the 1/2 point of the current box at 67.40.

Going Up From Here


Here is an updated hourly chart of Google. The solid blue line on the right of the chart is support level I calculated for you in this previous post. I think GOOG has now started a new up leg. The first upside target is the 1/2 point of the current box around the 292 level.

Bearish Sentiment in Stocks


I think the most remarkable thing about the bull market which started in October 2002 from the S&P 500 low at 768 is the unwillingness of investors to enjoy their good fortune. After every modest drop in the averages during the past three years bearish sentiment has emerged quickly and has risen to levels normally seen only at bear market lows. Evidently the scars of the 2000-2002 bear market run deep.

In judging the state of market sentiment I place much more emphasis on what the average member of the public thinks than on "expert" opinion. That is why I like to gather evidence for my "contrary opinion" analysis from the news media rather than from surveys of expert opinion.

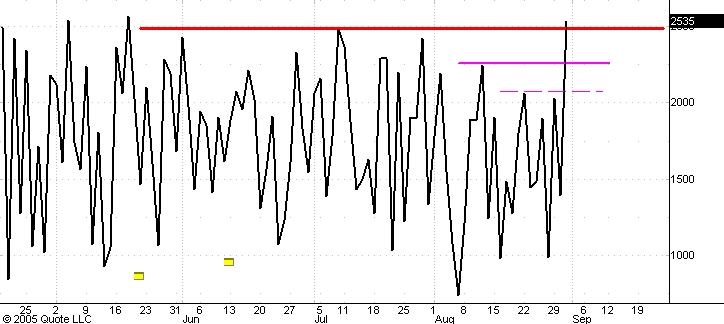
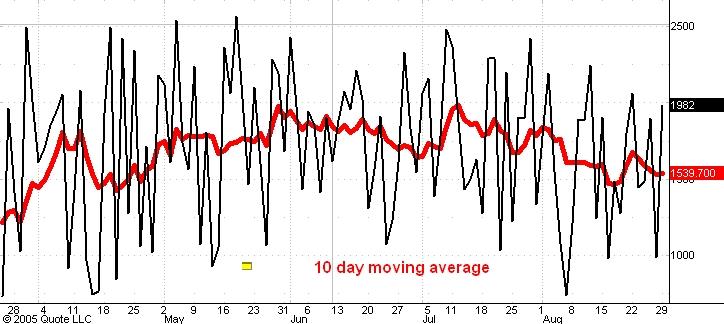
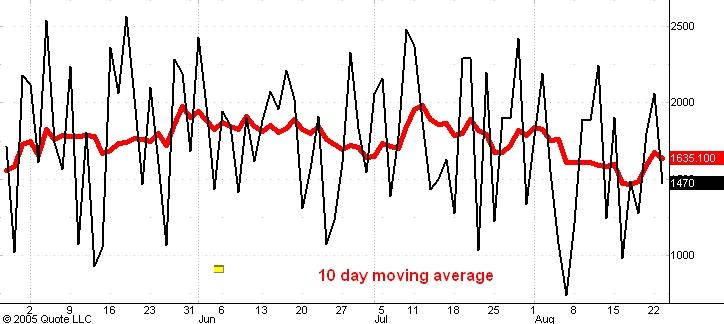
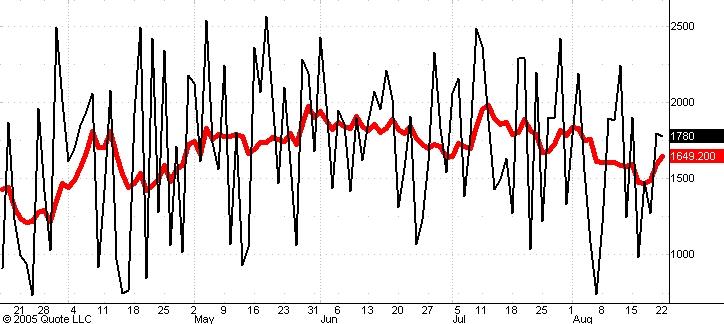
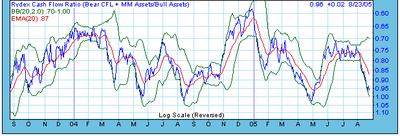
There is an interesting source of data about the views of "John Q. Public". It is the Ryex cash flow ratio compiled by DecisionPoint.com. (You have to be a subscriber to access this data but I think the $20/month cost is a bargain!)

The cash flow ratio has as its numerator the sum of the cash flow into Rydex bear funds plus the level of assets held in Rydex money market funds. This sum is a measure of the intensity of bearish sentiment. The denominator of the ratio is the level of assets held in Rydex bull market funds and dividing by this denominator serves to "normalize" the numerator so that comparisons across time are easier to make.

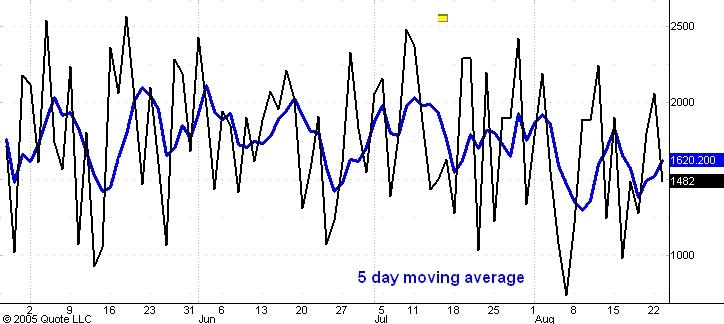
The chart above by DecisionPoint.com shows the Rydex cash flow ratio over the past two years. The scale is inverted so that high levels of the ratio (associated with high levels of bearish sentiment) show up at low levels in the chart, etc.

The most striking thing about this chart is that the Ryex cash flow ratio is now very close to the levels it reached last April and also in August 2004. Both were important intermediate term low points in the S&P and good times to put cash to work in stocks. The reason this current level of bearishness is remarkable is that the S&P 500 has dropped only 30 points from its July top as compared to the 100 point drops in the previous two cases cited.

This shows that "John Q. Public" is trying to pick the top of the current bull market. I don't see how he can succeed in this effort. This gives me a lot of confidence in my bullish stance.

Guesstimates on August 24, 8:40 am ET

S&P Futures: I think the market will hold 1217 support and start a rally to 1268.

Bonds: 116-30 is resistance today and from there the market will drop to 115-04 before resuming the rally into the 121-123 zone.

10 Year Notes: Resistance today is 111-31 and the notes will then drop to 110-30 before the rally resumes.

Eurocurrency: The market will hold supuport at 121.70. The next step up will carry to 125.60.

October Crude: The market will be tested by the petroleum status report at 10:30 am ET today but I think any bullishresponse will be short lived and that market will begin a drop to 60.50.

Gold: Support is at 444 and the next step up will carry to 463.

Google: 272 is support; the next move up will reach 343.

Tuesday, August 23, 2005

Divergence Continues


Here are two daily charts which update my posts here, here and here about the the current bullish divergence between the NYSE advancing issues numbers and the behavior of the S&P 500 index. The index made another new reaction low today so the divergence continues sending its bullish message to all who will listen.

New Baidu Boxes


Baidiu.com has traded long enough for me to get a better handle on its price boxes. The boxes I had been working with were just multiples of its IPO price of 27 but were not very useful.

The new price boxes are shown in the updated hourly chart you see above. They are 40.72 points high. Yesterday BIDU dropped to the bottom of its second box and also to the level which is 1/2 its all time high at 153.96. I commented yesterday on my plan for handling BIDU going forward. I think a big rally will develop from yesterday's low.

Bold and Right


A wealthy, semi-retired speculator was walking with his teenage granddaughter one day. The girl asked him, "Grandpa, how did you make so much money trading?"

The old man thought for a minute and said, "Well, you have got to be bold and you have got to be right!"

She asked, " What happens if you are bold and wrong?"

"Then you just go down with the ship!" , he replied.

Above you will see an updated hourly chart of October crude oil. I am predicting the market will go down from here and soon reach its short term target of 60.50. I am bold. But will I be right? I think so!

Don't Sell A Dull Market Short

Take a look at Mark Hulbert's latest column on MarketWatch.com. He observes that while the averages have traded in a narrow range over the past 4-6 weeks short term stock market timers have grown increasing bearish. This has bullish implications for stock prices.

This observation is consistent with the message of the Rydex Cash Flow Ratio which I discussed a short while ago.

The other interesting thing about the behavior of the stock market averages since January 2004 (a period of 19 months !) is that we have seen many, sometimes extended, periods of essentially sideways action puncuated by a brief, sharp advances or declines. This sort of behavior is the main identifying characteristic of George Linday's Three Peaks and a Domed House formation. I last commented upon this here where I said that it implies that the market will rally into December of this year. This too is consistent with the bearish condition of short term market timer sentiment.

Guesstimates on August 23, 8:30 am ET

S&P Futures: I think the market will hold 1217 support and start a rally to 1268.

Bonds: It still looks like the bonds will drop to 115-04 before resuming their rally into the 121-123 zone.

10 Year Notes: I think the notes will drop to 110-16 before the rally resumes.

Eurocurrency: The market will hold supuport at 121.70. The next step up will carry to 125.60.

October Crude: The market will now drop to 60.50.

December Gold: Support is at 444 and the next step up will carry to 463.

Google: 272 is support; the next move up will reach 343.

Monday, August 22, 2005

Low At Hand


For the past few days the September S&P futures have traded above and below the low of the box at 1224. I think this market is headed up from the low we made today at 1217.70.

I have a number of reasons for this prediction but perhaps the simplest one is the behavior of the New York Stock Exchange advancing issues number. I have recently commented on this indicator here and here.

The first chart above this post is an updated hourly chart of the September S&P futures. It has dropped nearly to its August 18 low at 1217.40 and may well break that low by a bit later today.

The second chart shows the daily number of NYSE advancing issues (black line) and the 10 day moving average of this number (red line). You can see that as the market has traded sideways the past few days the daily advancing issues number has made higher lows. Moreover, the 10 day moving average has already turned upwards.

So we see some subtle signs that the general market is strengthening even as the S&P is trading sideways to down. Since I am bullish on the longer term trend I feel comfortable interpreting this as a sign of an imminent low point.

Bye Bye Baidu ?


Here is an updated hourly chart of Baidu.com. I thought it wouldn't drop much below 90 but I was wrong.

Every Wall Street analyst I've read hates this stock. Lot's of people have been eagerly shorting it. It is obvious to everyone (including me!) that the stock price way overvalues the company. At least one of you predicts BIDU will drop to 14 over the next year!

Is it time to give up on BIDU ?

The right way to handle a situation like this one is to find a comparable company and compare stock price performance. Then compare performance relative to the market averages.

My choice for comparison is Google. Right now Google is selling around 275, about 220% above its IPO price of 85. BIDU at 75 is about 175% above its IPO price of 27. It has been more than a year since Google's IPO and only a bit more than a week since Baidu's IPO so I would rate this comparison favorable to BIDU. On the other hand BIDU has dropped 50% from its post - IPO high at 154 while GOOG is down only about 16% from its high at 320. So this comparison favors GOOG. Both stocks have recently made new bull market highs along with the S&P 500, so there is no adverse comparison here for either relative to the market.

At this juncture I am willing to bet that BIDU will establish a low around current levels which are roughly 50% of the all time high at 154 and a level that is normally strong support. (E.G. In October 2002 the cash S&P 500 made its bear market low at 768 while 50% of its all time high at 1553 was the 776 level.) The key question then will be how BIDU acts relative to GOOG and relative to the market on the subsequent rally. If its performance lags behind these two yardsticks significantly I would conclude that my long term target of 270 will not be reached during the coming year.

Running On Empty


My favorite newspaper, The New York Times, is telling its readers that the world is running out of oil! Above this post you will see the cover of yesterday's The New York Times Magazine. It depicts a fuel gauge on "empty". The cover article by Peter Maass is entitled "The Beginning of the End of Oil". Among other things the article discusses the increasingly popular theory of "peak oil" which predicts a top in world-wide oil production in 2006.

This NYTM cover is solid evidence of overwhelmingly bullish sentiment in the oil market. I think it is telling us that the next big move in crude oil will be downward from here and that the bull market in crude that started from $11 in 1998 is over.

UPDATE: Here is a fisking of this cover story by Freakonomics (Hat Tip: Instapundit)

Crude Oil


I thought that October crude oil would rally a couple of dollars from last week's low but the market has rallied more than three dollars. As you can see from the hourly chart above this post October crude has moved to the top of its current box. I think the next big move from here will be downward.

Guesstimates on August 22, 8:45 am ET

S&P Futures: I think the market will hold 1217 support and start a rally to 1268.

Bonds: It still looks like the bonds will drop to 115-04 before resuming their rally into the 121-123 zone.

10 Year Notes: I think the notes will drop to 110-16 before the rally resumes.

Eurocurrency: The market will hold supuport at 121.70. The next step up will carry to 125.60.

October Crude: The market moved past the 1/2 point of the current box at 65.30 but I think that was the rally's last gaspand I expect the market to start another down leg today.

Gold: Support is at 444 and the next step up will carry to 463.

Google: 272 is support; the next move up will reach 343.

Friday, August 19, 2005

Crude Oil


As you can see in the hourly chart posted above October crude oil has rallied to the 1/2 point of its current box at 65.30. If this market is as weak as I think it is the rally should stop here and crude should drop below 62.00 next week.

Guesstimates on August 19, 9:05 am ET

S&P Futures: I think the market will hold 1217 support and start a rally to 1268.

Bonds: It still looks like the bonds will drop to 115-04 before resuming their rally into the 121-123 zone.

10 Year Notes: I think the notes will drop to 110-16 before the rally resumes.

Eurocurrency: The market broke a little below 121.70 support this morning but I expect a close above that level today. The next step up will carry to 125.60.

October Crude: Stopped 20 cents shy of 62.50 yesterday and has already rallied a couple of dollars. The 1/2 point of the current box at 65.30 is resistance and I expect the market to start another down leg from there.

Gold: Support is at 444 and the next step up will carry to 463.

Google: 272 is support; the next move up will reach 343.

Thursday, August 18, 2005

Still There!


Speculation is all about anticipating changes. That's why I never have anything good to say about commentators who specialize in predicting the past. You just can't make any money doing that unless you are a market commentator yourself!

With this in mind let's take another look at the divergence I discussed yesterday in the the advancing issues data for the New York Stock Exchange.

The daily chart above this post shows the daily number of NYSE advancing issues (in black) and the 5 day moving average of this number (in red). The S&P 500 cash and futures made new reaction lows today. On the other hand the daily count of advancing issues looks like it is making a second consecutive higher low and the 5 day moving average is still above the lowest point it reached during this reaction. This is a clue that the market averages are about to turn upward.

Of course it could happen that we see new weakness tomorrow or Monday, enough weakness to destroy this divergence. But the S&P futures are trading near the bottom of their box and I think the bigger trend is upward for reasons I have repeated many times on this blog. So we are in a situation where it makes sense to anticipate an upturn in the market, relying on the evidence the divergence offers us, instead of waiting for the upswing to get well underway before recognize it.

Success in speculation comes to those who correctly anticipate upcoming market trends. Let's see how this attempt works out!

Another Googlestimate


I have been thinking that the 280 level was support for Google. As you can see in the hourly chart above the market broke below this level today. The bottom of the current box is 267 but I don't think GOOG will get near there.

Notice that the August 11 low at 280.62 was about $6.50 below the July 29 low at 286.99. Subtracting 6.50 from the 280.62 low we get 274.10 as a minor support level and reasonable downside target. I have other calculations that say that 271 should be the worst we see on the downside. So I conclude that GOOG will drop into the 271-274 zone and then start the next leg up in its bull market.

Crude Oil


Here is an updated hourly chart of the October crude oil futures. As I said in this mornings guesstimate I think the market will soon reach the bottom of its current box near 64.50 and then rally a dollar or two. I also think that the top earlier this week marked the end of the long bull market in crude (ed: He's said this before and was wrong!).

More Fun With Baidu


In this post about Baidu.com I said that it would hold the 1/2 point of its box near 94 and then head higher. As you can see from the updated hourly chart above I was dead wrong about this but BIDU has meanwhile dropped to the bottom of the same box. This is much stronger support and I expect it to rally to new highs from here.

Eurocurrency


This morning the September eurocurrency bounced off of 122.18 and I thought it was headed higher from there. Cleary I was wrong about that and now I think it will hold the bottom of the current box near 121.80 and head higher from there.

Guesstimates on August 18, 8:50 am ET

S&P Futures: I think that 1217 will be support today and that the market will start a rally to 1268 from there.

Bonds: It still looks like the bonds will drop to 115-04 before resuming their rally into the 121-123 zone.

10 Year Notes: I think the notes will drop to 110-16 before the rally resumes.

Eurocurrency: This morning the market broke below support at 122.70 but I think later today it will rally and close back above that level. The next step up will carry to 125.60.

October Crude: Will drop to the bottom of its current box near 62.50 and then rally a dollar or two.

Gold: Support is at 444 and the next step up will carry to 463.

Google: 280 is support; the next move up will reach 343.

Wednesday, August 17, 2005

Divergences


The only oscillator I follow and one that I have used for almost 40 years is the moving average of the number of daily advancing issues on the New York Stock Exchange.

Above this post you see two daily charts. On each chart the black line records the daily number of advancing issues. The red line on the first chart shows the 10 day moving average of the number of daily advances. The red line on the second chart shows the 5 day moving average of this number.

Notice first that the 10 day moving average is lower than at any time since the 1136 low in mid-April. Yet the S&P is only 25 points off of its high. I would expect a much bigger break to be assoicated with this oscillator level so this is a bullish piece of evidence. Next notice that yesterday the market established the low point of its reaction thus far, but the daily number (the black line) made a higher low relative to its 738 reading on August 5. Finally, observe that the 5 day moving average had already turned upward and did not "confirm" the new low for the reaction that was established yesterday.

Given that the market has only dropped a bit below the bottom of its box at 1224 I have to regard the oscillator evidence as definitely bullish and supporting my view that the market is headed for 1268 soon.

Crude Oil


As you can see on the hourly chart above September crude oil futures have dropped to the bottom of the current box which was my initial downside target. Now we shall see whether or not the bulls can take control again. If the market is as weak as I think then it won't rally more than a dollar before heading downward once more.

Tomorrow I shall switch my analysis to the October contract so I've put a chart of this contract above this post. The boxes are at the same price levels as those in the September contract. The market has dropped to the 1/2 point of its current box but should not rally past the top of that box.

Guesstimates on August 17, 9:05 am ET

S&P: The market broke below the bottom of the box at 1224 but would have to spend a couple of days trading below that level before I would look for a move to 1202, the 1/2 point of the current box. My best guess is that the S&P's will instead rally from here back above 1224 and begin a move to 1268.

Bonds: I think the bonds will drop a box or so from yesterday's high at 116-16 before the rally resumes.

10 Year Notes: I think the notes will drop a box or so from yesterday's high before the rally resumes.

Eurocurrency: Will hold support at 122.70. The next step up will carry to 125.60.

September Crude: I think the market will hold Friday's high at 67.10 and head down to 64.40.

Gold: Support is at 444 and the next step up will carry to 463.

Google: 280 is support; the next move up will reach 343.

Tuesday, August 16, 2005

Bonds and Notes


The updated hourly charts above show that the bonds and notes have both rallied two boxes from last weeks lows. I think today's highs will be followed by reactions of about a box. The bonds are headed for the 121-123 range and the notes for 116 over the next few months.