
A couple of months ago I explained in this post, Three Peaks and a Domed House in the Dow , how the movements in the Dow industrials over the past 18 months can be interpreted as an example George Lindsay's Three Peaks and a Domed House formation. I'd like to update my thinking on this situation now.
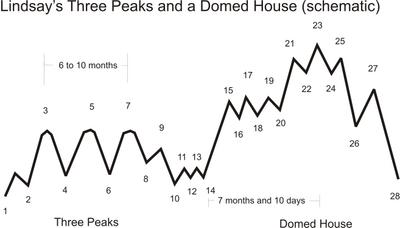
The first chart you see above this post is a schematic which illustrates the standard example of a three peaks and domed house formation. Lindsay once estimated that the Dow was in the midst of such a formation roughly 60% of the time over the 120 years of stock market history he had examined. Major examples of the formation typically last 20-24 months from start to finish, so if you can recoginize one in its early stages you have a good market roadmap for the next year or two.
Right now I see two simple interpretations of the Dow's movements since February 2004 as a three peaks formation.
In the first interpretation black numerals match points on the weekly chart of the Dow you see above to the corresponding points in the schematic. The three peaks, labeled 3, 5 and 7, occurred between February and September 2004. This was a 6 1/2 month time span and qualifies this as a "major" three peaks formation. Point 10 occurred in October 2004 and Lindsay's "five reversals" are labeled 15 - 20. If this interpretation is correct then the Dow has begun a rally to the domed house house which will look a bit like a classic "head and shoulders" and eventually carry the labels of points 21 - 25.
In this interpretation there is no obvious point 14 (and hence no black numeral 14). In such a case Lindsay was willing to count the 7 month 10 day time period beginning from one of the lows within the five reversals. This would predict that point 23 or point 27 will come sometime between September 2005 and February 2006. The peak of the current bull market would thus be due during that time.
The second interpretation uses red numerals to match points in the Dow chart to points in the schematic. I like this interpretation better because it contains a very clearly identified point 14, the low of May 13. Counting forward 7 months and 10 days we arrive at Demember 23 as the likely time for point 23, the peak of the domed house.
Both interpretations say the the top of the current bull market is due sometime between September 2005 and February 2006. At what level might the top occur? To make a guess at this we work backwards using Lindsay's theory as a guide.
Lindsay pointed out that after the completion of the domed house the Dow generally drops to roughly the level of the correponding point 10, in this case either the 9700 level or the 10000 level. I think this drop will occupy most of 2006. If this drop amounts even to only 20% and goes to 9700, the intervening high in the Dow (point 23) should be above 12000.
1 comment:
Interesting take. The reason I would even leave a comment is because I have seen recently some stuff written by Dow Theorists with the exact time frame for a top in the market. The difference is that they are calling for a much lower low than your 9700. Theirs is closer to 6000. They are also predicting a much lower high than 12000.
Can't wait to see it all play out.
How I found this blog: I saw a post of yours at Kudlow's blog once and have followed your writing.
Uncle Jack
Post a Comment