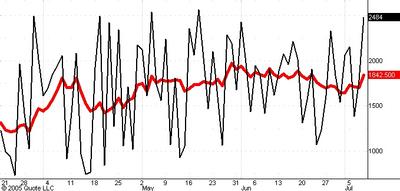
Take a look at the chart above which shows the daily count of the number of issues on the New York Stock Exchange which advance in price (black line) and the 10 day moving average of this number (red line).
On Friday the number of advancing issues was the highest in six weeks and this number shows an upward zig- zag (higher high following a higher low). Moreover, this upward zig-zag occurred after the advancing issues count and its 10 day moving average refused to confirm the market's new reaction low on Thursday.
All in all, this picture has very bullish implications.
No comments:
Post a Comment