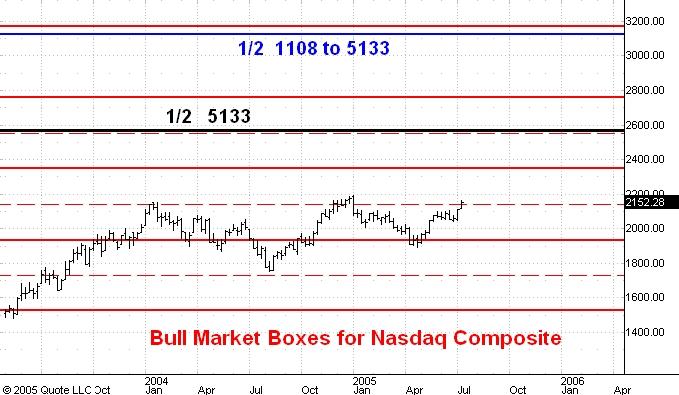
Here is an updated weekly chart of the Nasdaq Composite index. I last discussed this chart here and here.
I think the index is on the verge of an upside breakout which will eventually carry it to the 1/2 division point of the range of the 2000-2002 bear market. This is the blue line you see near the top of the chart near 3130.
No comments:
Post a Comment