Friday, June 30, 2006

Three Peaks and a Domed House


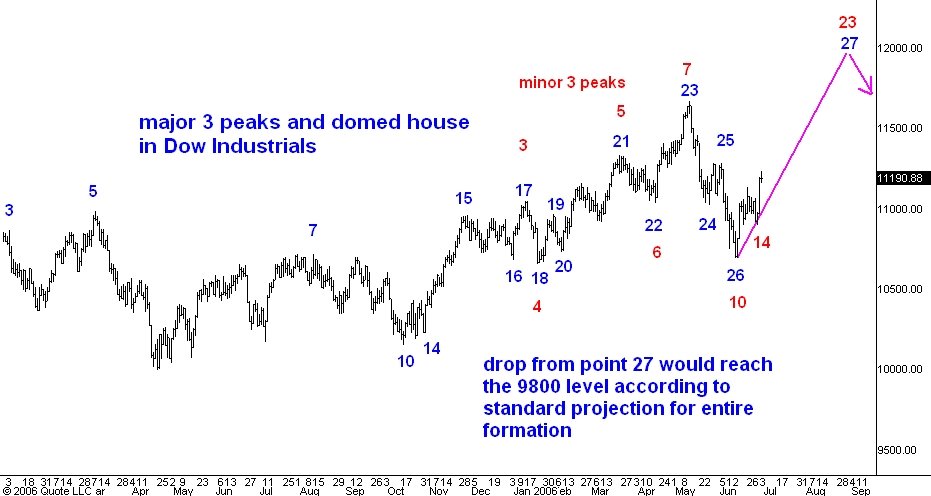
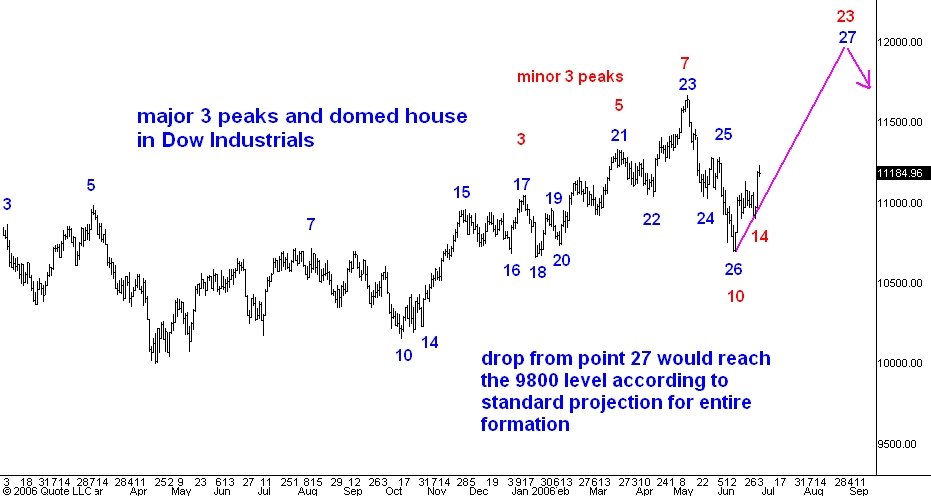
Here is a daily chart of the Dow Industrial average going back to the start of the major three peaks and domed house formation which is underway. I have been tracking George Lindsay's Three Peaks and a Domed House formations in the Dow and the S&P. You can read my real-time analyses here.

I think that the June 14 low in the Dow was point 26 of the major formation. There is so much unreasoning bearish sentiment in the US stock market that I think the rally to point 27 will carry the average to new bull market highs. My best guess is for a top near 11900 which would be a new historical high for the Dow as well.

There is another reason for thinking the move to point 27 will make a new high for the bull market. On the chart I have labeled in red numerals a minor example of a three peaks and domed house. In this minor formation the June 14 low is point 10. The June 28 low is point 14 and completed a very symmetrical "base" in Lindsay's terminology. This increases my confidence that this minor formation is a valid one. The domed house should carry the average above the highest of the three peaks. So this minor formation is predicting a new bull market high dead ahead.

When might the upcoming top occur? The 7 month, 10 day standard time interval from blue point 14 timed blue point 25 in my opinion. So the standard interval in the major formation is not helpful here.

The standard time interval in a minor (red) formation is harder to apply since the interval is not likely to start at red point 14. My best guess is that point 23 of the minor formation (and point 27 of the major formation) will develop about 7 months and 10 days from either red point 4 or red point 6. This predicts a bull market top for either August 30 or November 27 of 2006.

In any case, after point blue 27 and red 23 is in place Lindsay's theory says that the market should drop to the start of the major (blue) formation. This in my opinion is the 9708 level which marked the October 25, 2004 low in the Dow. This would be about a 20% drop from the projected top near 11900.

Euro-Dollar


Here is a daily bar chart of the euro-dollar currency pair. I last commented on this chart here.

As you can see the market has broken to the upside out of its recent three week trading area. This tells me that the euro-dollar pair is heading for the 131 level. From there I expect a drop to below the 116 level.

Dollar - Yen


Here is a daily chart of the dollar-yen pair. I last commented on this market here.

As you know I am expecting the yen to rally to the 130 level over the next year or so. But the price action since yesterday's rate hike by the US Fed is telling me that a drop to 111.50 is underway. From there the move up to 130 should resume.

Gold


Here is an hourly chart showing pit and electronic trading in August gold futures. I last commented on this market here.

As you can see the market has broken decisively above resistance at the 600 level which is the 2 and 3/8 multiple of the 1999 low of 252.

This tells me that the 546 low ended the break from the 732 level and that the $100 rally I have been expecting is already underway. My upside target is 662 which is the 2 and 5/8 multiple of the 1999 low.

Silver


Here is an hourly chart showing pit and electronic trading in September silver futures. I last commented on this market here.

As you can see the market has moved visibly above the 1088 resistance level I cited in this morning's guesstimate. In doing so it shows a decisive breakout above the double top at 1074 which I have drawn on the chart.

This tells me that the 945 low (in the July contract - September's low was 954) ended the break from 1520 and that the two to three dollar rally I had been expecting is already underway. My upside target for this rally is 1272 which is the 3 and 5/8 multiple of the 1991 low at 351.

Guesstimates on June 30, 8:50 am ET

September S&P Futures: The market has reached and moved a bit above the 1282 resistance level. Today I see support near 1272. Next short term resistance above the market is at 1295. I think the market ended the drop from the May 5 top at the June 14 low of 1229. A move to new bull market highs is underway.

September Bonds: I think this market is headed downward.  Next support beneath the market is at 105-04. Resistance is again at 106-08 and any strength above that level is likely to switch me back to the bull side on the bonds. Failing that I shall stick with my view that the market is headed down into the 103-104 zone.

September 10 Year Notes: Resistance above the market is at 104-18 while support is at 103-28. I still think that a  drop into the 102-103 zone is underway but strength above 104-18 can change my mind about this.  

Euro-US Dollar: The euro has broken decisively above 126.50 resistance so I conclude that the trend has turned back upward. It looks like we are headed for the 131.00 level. Support today is at 126.60.

Dollar-Yen: The yen has decisively broken below support at  115.00 so I conclude that the market is headed down to 111.50. I still think the yen is headed for the 130 level over the next year.

August Crude: This market has been much stronger than I have expected. I still think that the 75.35 top will hold and that the next big move will be a drop below 68.00.  

August Gold: Resistance today is at 603 and I still think that gold is about to drop into the 530-35 range.

September Silver: Switching to the September contract. Resistance is at 1088 and I am expecting a drop to an important low in the 920-30 range.

Google:  Support is at 400 and I think GOOG will soon reach 430. I expect to see the market reach the 450-500 zone this summer.

Thursday, June 29, 2006

S&P


Here is a 15 minute bar chart showing regular hours trading in the September S&P e-mini futures. I commented on this chart yesterday afternoon.

The market has nearly reached the 1282 resistance level. I don't think we shall see much of a reaction from that level. I estimate support at 1272, a shade above the 1270.75 top made on June 15.

I think the market is in the early stage of an advance from the June 14 low of 1229 which will take it to 1350 this summer.

Euro - US Dollar and Dollar-Yen


Here is an hourly chart of the Euro - US Dollar pair. I last commented on this market yesterday.

The Fed's announcement of a 25 basis point rate increase which came about 30 minutes ago has made the market think that the Fed "pause" is imminent. Consequently there has been a big rally in the Euro-USD and a big break in the USD-Yen.

The rally in the Euro-USD has brought the market to the 126.50 resistance level I was watching in yesterday's guesstimate. I think the market is about to halt near here and resume its drop.

The yen had gone about 50 pips lower than the 125.50 support level I was watching but I think it will hold the 115.00 level and resume its upmove.

Guesstimates on June 29, 8:50 am ET

September S&P Futures: The market is headed for 1282.  Today the 1255 level is again support. I think the market ended the drop from the May 5 top at the June 14 low of 1229. A move to new bull market highs is underway.

September Bonds: This afternoon the Fed announcement will add volatility to the market but I doubt that the net result will amount to much. Resistance above the market is at 106-08 while minor support is at 105-04. I think the market is headed down into the 103-104 range.

September 10 Year Notes: Resistance above the market is at 104-18 while support is at 103-28. The drop into the 102-103 zone is still underway.  

Euro-US Dollar: The market is headed down to temporary support at 124.30. An extended drop which should carry below 116 is underway.  

Dollar-Yen: The yen  now appears ready to drop to 115.50 or so. The market is in the early stage of  a move to 130.  

August Crude: Resistance is still at 72.90. The next development should be a break below 68.00.

August Gold: Resistance today is again at 590. Gold has now completed a three phase rally and will probably drop to a more important low in the 530-35 range.

July Silver: Resistance today is at 1050. I am expecting a drop to am important low in the 920-30 range.

Google:  Support is at 390 and I think GOOG will soon rally to 430. I expect to see the market reach the 450-500 zone this summer.

Wednesday, June 28, 2006

S&P


Here is a 15 minute bar chart showing regular hours trading in the September S&P e-mini futures. I commented on this chart yesterday afternoon.

You can see that the market dropped as low as 1246.50 today, taking just a peek below the 1247.25 low made on June 19. I was looking for a drop into the 1240-43 range but the market didn't follow through on the downside breakout.

A failure to follow through on an obvious breakout is usually a warning that a trend in the opposite direction is about to begin.

In the current situation I am inclined to take this warning seriously for several reasons. First, I think this market has a lot of bullish potential. Second, by taking a peek below the 1247.25 level the drop from the 1270.75 high on June 15 now looks like a three stage correction. Third, the advancing issues number today is higher than yesterday's despite the new correction low for the market and this was true even when the 1246.50 level was hit. This emphasizes the bullish divergence I discussed earlier this week.

All in all I think the evidence now points to an imminent move to 1282 and eventually higher than that. A break above the 1255 resistance level will be a late confirmation of this view.

Google


Here is a daily chart of Google. I last commented on GOOG here.

Google ended a drop from the 455 level at 360 on May 19 and since then has steadily moved higher. This is very good price action in the face of a sharp drop in the averages that ended 3 weeks later on June 14. GOOG has been hesitating at 410 resistance but I think it will drop no lower than 390 before rallying to the next resistance near 430.

I am still very bullish on GOOG and think it has a good shot at the 530 level later this year.

Silver


Here is an hourly chart showing pit and electronic trading in July silver futures since the low at 945 on June 14. I last commented on this market here.

I think that the three phase rally from 945 ended at 1066 and now I expect the market to drop to 920 which is the 2 and 5/8 multiple of the 1991 low at 351. After 920 is reached I think a rally of 2 or 3 dollars will begin.

Gold


Here is an hourly chart showing pit and electronic trading in August gold futures since the 546 low a couple of weeks ago. I last commented on gold here.

I think gold has ended its rally from 546. The next development should be a drop to long term support at 535 which is the 2 and 1/8 multiple of the 1999 low at 252. Once the 535 level is reached I think the market will rally $100 or so.

Euro USD


Here is an hourly chart of the Euro-US Dollar pair. I last commented on this market here.

In this morning's guesstimate I said that the 125.540-50 support zoned would probably hold and that a rally to 126.40 would ensue. However, as you can see the market has accelerated below support and so I conclude that it is now headed for the 124.30 target.

Guesstimates on June 28, 8:50 am ET

September S&P Futures: Yesterday’s 1255 support level was broken and is now resistance today.  I am looking for a move down into the 1240-43 zone and then a rally to 1282. I also think the market ended the drop from the May 5 top at last week’s 1229 low. A move to new bull market highs is underway.

September Bonds: The bonds will probably rally a bit further to 106-12 but then I will be expecting a move down into the 103-104 range.

September 10 Year Notes: The notes will probably rally a bit more to 104-20 but then a drop into the 102-103 zone will resume.  

Euro-US Dollar: Support is the 125.40-50 zone and I suspect that a rally to 126.45 will develop today or tomorrow. Nonetheless, the next big swing from here will be downward to support at 124.30. An extended drop which should carry below 116 is underway.  

Dollar-Yen: The yen  now appears ready to drop to 115.50 or so. The market is in the early stage of  a move to 130.  

August Crude: The market should stop near 72.90. After this rally I expect a break below 68.00.

August Gold: Resistance today is at 590. Gold has now completed a three phase rally and will probably drop to a more important low in the 530-35 range.

July Silver: Resistance today is at 1036. I am expecting a drop to am important low in the 920-30 range.

Google:  Support is at 390 and I think GOOG will soon rally to 430. I expect to see the market reach the 450-500 zone this summer.

Tuesday, June 27, 2006

S&P


Here is a 15 minute bar chart showing regular hours trading in the September S&P e-mini futures since the June 14 low at 1229. I last commented on this chart here.

As you can see the market has spent most of the day trading below what I thought would be support at 1255. This tells me that we are now in the third phase of a three phase correction from the 1270.75 high on June 15. I have drawn the phases of this correction in green.

Right now I am expecting a low in the 1240-43 range and I think it will be followed by a move to 1282. I still expect to see the 1350 level later this summer.

Guesstimates on June 27, 8:50 am ET

September S&P Futures: Friday’s action convinced me that the market is headed up to 1282. Today the 1255 level is support. I also think the market ended the drop from the May 5 top at the June 14 low of 1229. A move to new bull market highs is underway.

September Bonds: The bonds have dropped close to the 105-12 target. From that level a rally of 25-30 ticks is likely but then the swing down from 108-16 should resume.

September 10 Year Notes: The notes will probably drop to 103-24 before a rally of more than 15 ticks develops.

Euro-US Dollar: I think that the market’s next swing will be downward from yesterday’s 126.18 high. The next downside target is 124.30. An extended drop which should carry below 116 is underway.

Dollar-Yen: The yen didn’t quite make it to 117.00 resistance but now appears ready to drop to 115.50 or so. The market is in the early stage of a move to 130.

August Crude: The market has moved well past resistance at 70.80 but should stop near 72.90. After this rally I expect a break below 68.00.

August Gold: Resistance today is at 595. Gold has now completed a three phase rally and will probably drop to a more important low in the 530-35 range.

July Silver: Resistance today is at 1045. I am expecting a drop to am important low in the 920-30 range.

Google: Support is at 385 and I think GOOG will soon rally to 430. I expect to see the market reach the 450-500 zone this summer.

Monday, June 26, 2006

NYSE Advancing Issues


Here is a line chart showing the daily count of the number of issues traded on the New York Stock Exchange which advance in price. The red line is the 10 day moving average of this number. I last commented on this indicator here.

The S&P's are very quiet today (so far) and are trading roughly in the middle of last week's range. This sort of situation does not arise too frequently, but when it does it is generally wise to follow the market's direction as soon as it shows obvious movement on increasing trading volume with expanding ranges.

Right now I think it is reasonable to expect the movement out of this narrow range to be upward. The chart above shows one reason why.

Note that the low on June 14 at 1229 in the futures occurred with the 10 day moving average visibly above the low it had made in May. Moreover, you can see the sequence of higher lows made by the daily numbers. These are all signs that the selling squall has abated and that the technical condition of the market is strengthening. I note also that today, despite the narrow range, more than 50% of the issues traded so far are trading above Friday's close, another sign of a strengthening market.

I think the S&P's are headed for 1282 and that the market will reach the 1350 level this summer.

Guesstimates on June 26, 8:50 am ET

September S&P Futures: Friday’s action convinced me that the market is headed up to 1282. Today the 1250 level is support.  I also think the market ended the drop from the May 5 top at last week’s 1229 low. A move to new bull market highs is underway.

September Bonds: The bonds didn’t rally Friday as I thought they would and this morning had dropped close to the initial 105-12 target. From that level a rally of 25-30 ticks is likely but then the swing down from 108-16 should resume.

September 10 Year Notes: The notes will probably drop to 103-24 before a rally of more than 15 ticks develops.

Euro-US Dollar: The market has rallied from the 124.76 level and will probably reach 125.90 before the drop resumes.  The next downside target is 124.30. An extended drop which should carry below 116 is underway.  

Dollar-Yen: The yen didn’t quite make it to 117.00 resistance but now appears ready to drop to 115.50 or so. The market is in the early stage of  a move to 130.  

August Crude: The market has reached resistance at 70.80 and now should drop to 65.70.

August Gold: Gold has now completed a three phase rally and will probably drop to a more important low in the 530-35 range.

July Silver: Silver reached 1066 resistance and should now drop to a more important low in the 920-30 range.

Google:  Support is at 380 and I think GOOG will soon rally to 430. I expect to see the market reach the 450-500 zone this summer.

Friday, June 23, 2006

S&P


Here is a 15 minute bar chart showing regular hours trading in the September S&P e-mini futures. I last commented on this chart here.

As you can see the market has staged a high volume, wide range breakout from a trading range that formed subsequent to yesterday's early break. Since I am basically bullish on this market I have to go with this sort of decisive bullish action. So I am abandoning my 1243 target and now expecting to see a move to 1282.

Guesstimates on June 23, 8:50 am ET

September S&P Futures: I expect the S&P’s to drop to 1243 and then to begin a rally to 1282. I also think the market ended the drop from the May 5 top at last week’s 1229 low. A move to new bull market highs is underway.

September Bonds: The bonds will probably rally to 106-16 today but then should resume their drop to 105-12 and lower.

September 10 Year Notes: The notes will probably rally to 104-24 today but then will resume a drop to 103-24 and lower.

Euro-US Dollar: The market is on its way to 124.30. An extended drop which should carry below 116 is underway.  

Dollar-Yen: The yen should soon reach resistance at 117.00. The market is in the early stage of  a move to 130.  

August Crude: The market has reached resistance at 70.80 and now should drop to 65.70.

August Gold: Gold has now completed a three phase rally and will probably drop to a more important low in the 530-35 range.

July Silver: Silver reached 1066 resistance and should now drop to a more important low in the 920-30 range.

Google:  Support is at 380 and I think GOOG will soon rally to 430. I expect to see the market reach the 450-500 zone this summer.

Thursday, June 22, 2006

T-bonds


Here is an hourly chart of regular hours trading in the September T-bond futures. I last commented on this market here.

I had expected the drop from the 108-12 high to assume a three phase shape but as you can see the market has been going straight down without interruption from that high. Moreover, this morning it has been trading visibly below support at 106-04.

I must conclude that over the next day or two we shall see more downside activity which will carry to support near 105-12. After a brief rally I shall then expect continuation down to new bear market lows near the 104-00 level.

S&P


Here is a 15 minute bar chart showing regular hours trading in the September S&P e-mini futures. I last commented on this chart here.

In this morning's guesstimate I said that the 1255 level would be support today and that the market would soon reach the 1282 level. I thought that the move down to 1255 would take a typical three phase form which would indicate that it was corrective in nature. But as you can see the market has dropped from yesterday's high of 1268.50 to 1254.50 in a straight line without even a hint of an intervening second phase rally.

I must conclude that the move up from 1254.50 will only be a second phase rally which will probably end near 1262. After that I am looking for a third phase break which will carry to 1243, my original target for the correction from the June 15 high. A low at 1243 would give the whole drop from 1270.75 on June 15 a clear and very symmetrical three phase appearance.

Once the 1243 low is in place I expect the market to move up to 1282.

Guesstimates on June 22, 8:50 am ET

September S&P Futures: Support today is at 1255. I think the market is on its way to 1282. I also think the market ended the drop from the May 5 top at last week’s 1229 low. A move to new bull market highs is underway.

September Bonds: I think support at 106-04 will hold and that the market is headed up to 107-24. Over the next few weeks the market should reach the 110-111 zone.

September 10 Year Notes: Support at 104-16 will hold and the notes should now head back up to 106-04. I expect the market to rally over the next few weeks into the 107-108 zone.  

Euro-US Dollar: The three phase correction ended at this morning’s high of 126.79. The next step down will carry the market to 124.30. An extended drop which should carry below 116 is underway.  

Dollar-Yen: The yen has bounced of support near 114.30 and now should rally to 117.00 short term resistance. The market is in the early stage of  a move to 130.  

August Crude: The market has reached resistance at 70.80 and now should drop to 65.70.

August Gold: Gold broke a bit above 594 resistance but I think it has now completed a three phase rally and will probably drop to a more important low in the 530-35 range.

July Silver: Silver reached 1066 resistance and should now drop to a more important low in the 920-30 range.

Google:  Support is at 380 and I think GOOG will soon rally to 410. I expect to see the market reach the 450-500 zone this summer.

Wednesday, June 21, 2006


15 minute bar chart of September S&P

S&P Update

Here is a 15 minute chart of regular hours trading in the September S&P futures. I commented on this market about an hour ago.

As you can see the S&P's have moved visibly above the 1263 level and this forces me to abandon the 1238 downside target. I think we are headed for 1282 and that we shall see much higher prices than that over the next couple of months.

S&P


Here is a 15 minute bar chart of regular hours trading in the September S&P e-mini futures. I last commented on this market here and later in this morning's guesstimate.

In this morning's guesstimate I said that I thought yesterday's rally was probably only the second phase of a three phase correction instead of the start of a move to 1282 which was my view yesterday.

The strong rally after today's pit open carried the market above yesterday's high, but the entire move up from 1247.25 to 1261.50 looks like a three phase rally. I am going view it as such unless the market shows strength above the 1263 level. If I am right about this then the rally which started from Monday's low is only the second phase of a three phase drop from 1270.75. This in turn means that the market will soon start a drop to the third phase low which I expect to develop around 1238.

Once the correction from the 1270.75 level ends I am expecting a move up to 1282. I still think we shall see the S&P at 1350 this summer.

Guesstimates on June 21, 8:50 am ET

September S&P Futures: I now think yesterday’s rally was only the second stage of a three stage drop from 1270. This implies that the market is headed for support at 1243. The odds are 50-50 that it will reach a slightly lower target near 1238. After this low is established the next step up should be to 1282. I think the market ended the drop from the May 5 top at last week’s 1229 low. A move to new bull market highs is underway.

September Bonds: I think support at 106-04 has held and that the market is headed up to 107-24. Over the next few weeks the market should reach the 110-111 zone.

September 10 Year Notes: Support at 104-16 has held and the notes are now headed back up to 106-04. I expect the market to rally over the next few weeks into the 107-108 zone.

Euro-US Dollar: The move up from yesterday’s low looks like the third phase of a three phase rally which should end near 126.80. The next step down will carry the market to 124.30. An extended drop which should carry below 116 is underway.

Dollar-Yen: The yen has bounced of support near 114.30 and now should rally to 117.00 short term resistance. The market is in the early stage of a move to 130.

August Crude: The market should reach 66.50 soon. Resistance today is again at 70.80.

August Gold: Gold has completed a three phase rally to resistance and now will probably drop to a more important low in the 530-35 range.

July Silver: Silver still has a shot at 1066 but that would complete a three phase rally to resistance and be followed by a drop to a more important low in the 920-30 range.

Google: Support is at 380 and I think GOOG will soon rally to 410. I expect to see the market reach the 450-500 zone this summer.

Tuesday, June 20, 2006

Silver


Here is an hourly chart showing pit and electronic trading in July silver futures. I last commented on silver here.

I think silver has begun the third phase of a three phase rally which now looks likely to end near resistance at 1066. After this third phase up move is complete I expect a drop to 920 or so which is the 2 and 5/8 multiple of the 1991 low of 351.

Once the 920 level is reached I think we will see a rally in silver of between two and three dollars.

Gold


Here is an hourly chart showing pit and electronic trading in August gold futures. I last commented on gold here.

I think gold is in the process of putting in an important low near the 535 level which is the 2 and 1/8 multiple of the 252 low made in 1999.

Right now I think the 580 level is resistance, but if the market breaks above there then I will expect continuation up to 594. In either case the next significant move should be a drop into the 520-535 zone. After that I think a rally of about $100 will be a reasonable expectation.

S&P 11:30 am EDT


Here is an updated 15 minute bar chart showing regular hours trading in the September S&P e-min futures. I commented on this market about an hour ago.

I think the market has broken decisively above what I see as resistance near 1256. The rally from yesterday's low at 1247.25 is now the biggest rally since the 1270.75 top made last Thursday. These two facts mean that the drop from 1270.75 is over and that the market is now headed for 1282.

I am especially encouraged by the fact that this correction stopped exactly on the 1 and 5/8 multiple of the 2002 low at 767.50. The market has "climbed back on top" of long term support and this is another piece of evidence that the S&P's are headed for 1350 this summer.

S&P


Here is a 15 minute bar chart showing regular hours trading in the September S&P e-mini futures. I last commented on this chart yesterday afternoon.

I think the market is about to stall at resistance near 1256 this morning and then drop to support near 1243. Once the low is in place I expect an upswing to 1282.

My longer term view is that last week's low at 1229 will hold and that the S&P's are headed up to 1350 this summer.

Guesstimates on June 20, 8:50 am ET

September S&P Futures: The market should drop to 1243 or so and then rally to 1282. I think the market ended the drop from the May 5 top at last week’s 1229 low. A move to new bull market highs is underway.

September Bonds: I think the market is headed for 106-04 before it rallies significantly. Over the next few weeks the market should reach the 110-111 zone.

September 10 Year Notes: The notes should continue down to 104-16. I expect the market to rally over the next few weeks into the 107-108 zone.  

Euro-US Dollar: I think the downtrend has resumed and that the market will soon reach the 124.30 level. An extended drop which should carry below 116 is underway.  

Dollar-Yen: The yen should find support near 114.30 and then rally to 117.00 short term resistance. The market is in the early stage of  a move to 130.  

August Crude: The market should reach 66.50 soon. Resistance today is again at 70.80.

August Gold: Gold has completed a three phase rally to resistance and now will probably drop to a more important low in the 530-35 range.

July Silver: Silver has completed a three phase rally to resistance and now should drop to a more important low in the 920-30 range.

Google:  Support is at 380 and I think GOOG will soon rally to 410. I expect to see the market reach the 450-500 zone this summer.

Monday, June 19, 2006

S&P Update


Here is a 15 minute bar chart showing regular hours trading in the September S&P e-mini futures.

In this morning's comment on this market I said that the break below support at 1261 meant that the market would drop to 1243. So far the S&P's dropped as low as 1247.25 but I think there is still a good chance that early tomorrow we will see the market closer to 1243 or even a bit below there. Any strength above 1256 would tell me that the drop from 1270.75 is over and that the market is headed for its next upside target at 1282.

I have also shown on this chart the 1 and 5/8 multiple of the 2002 low at 767.50 which stands at 1247. A low near there would be another very bullish indication because it will show that the market is "climbing back on top" of strong, long term support which was broken briefly on the way to last week's 1229 low.

15 minute bar chart of September S&P's

S&P

Here is a 15 minute bar chart showing regular hours trading in the September S&P e-mini futures. I last commented on this chart Friday.

In this morning's guesstimate I said that the 1261 level should be support today and that the market would soon rally to 1282. A short while ago the market broke decisively below 1261 so now I think that it is headed down to 1243. The drop from this morning's high at 1267 looks like the third phase of a three phase correction.

I still think the 1229 low made last week will hold and that the S&P will move to the 1350 level this summer.

Guesstimates on June 19, 8:50 am ET

September S&P Futures: I think the market ended the drop from the May 5 top at last week’s 1229 low. Support today is at 1261 and I think the market will rally to 1282 in a day or two. A move to new bull market highs is underway.

September Bonds: The bonds broke 106-28 support Friday so now I think the market is headed for 106-04 before it rallies significantly. Over the next few weeks the market should reach the 110-111 zone.

September 10 Year Notes: The notes broke below 104-30 support Friday and so should continue down to 104-16. I expect the market to rally over the next few weeks into the 107-108 zone.  

Euro-US Dollar: I think the downtrend has resumed and that the market will soon reach the 124.30 level. An extended drop which should carry below 116 is underway.  

Dollar-Yen: The yen is on its way to 117.00 short term resistance. The market is in the early stage of  a move to 130.  

July Crude: The market should reach 66.50 soon. Resistance today is again at 70.50.

August Gold: Gold has completed a three phase rally to resistance and now will probably drop to a more important low in the 530-35 range.

July Silver: Silver has completed a three phase rally to resistance and now should drop to a more important low in the 920-30 range.

Google:  Support is at 380 and I think GOOG will soon rally to 410. I expect to see the market reach the 450-500 zone this summer.

Friday, June 16, 2006

T-bonds


Here is an hourly chart showing regular hours trading in the September T-bond futures. I last commented on this market here.

I think the bonds are in the middle of a three phase drop from the 108-16 level. This correction should carry the market to support at 106-04. Meantime I am expecting a second phase rally from support at 106-28 to resistance near 107-20.

I think there is a very good chance that the May low at 105-06 in the September contract will be the low for 2006. In any event I expect the bond futures to trade into the 110-111 range over the next few weeks.

S&P


Here is a 15 minute bar chart showing regular hours trading in the September S&P e-mini futures. I last commented on this chart yesterday afternoon.

In this morning's guesstimate I said that the S&P would probably drop to support at 1255. The first hour price action shows a steady drop to 1261.25 and I now think the market is about to turn upward and rally to 1275. From resistance near 1275 I am expecting to see a three phase correction like the one I have illustrated in the chart. My guess right now is that the correction will probably carry the S&P's down to 1250 or so, but I would not be surprised by a bigger drop than that. Even so I expect the 1229 low to hold and to see the market over 1350 this summer.

Guesstimates on June 16, 8:50 am ET

September S&P Futures: I think the market ended the drop from the May 5 top at 1229 Wednesday. 1266 resistance was hit and slightly exceeded yesterday and today I think the market will probably react to support near 1255.  Resistance above yesterday’s high is at 1275. A move to new bull market highs is underway.

September Bonds: The bonds have nearly reached support at 106-28 but the move down looks like only the first phase of a three phase correction. I expect a rally to 107-20 or so followed by a third phase drop to 106-04. Over the next few weeks the market should reach the 110-111 zone.

September 10 Year Notes: The notes stopped at 104-30 support yesterday and will probably stage a second phase rally to 105-16. Then the drop from 106-04 will resume and end near 104-18. I expect the market to rally over the next few weeks into the 107-108 zone.  

Euro-US Dollar: I still think this market has a good shot at reaching the 126.90 level before it drops to 124.30 which is the next short term downside target. An extended drop which should carry below 116 is underway.  

Dollar-Yen: The yen should hold support around 114.30 and then rally to 117.00 or so. The market is in the early stage of  a move to 130.  

July Crude: The market should reach 66.50 soon. Resistance today is again at 70.50.

August Gold: Gold has completed a three phase rally to resistance and now will probably drop to a more important low in the 530-35 range.

July Silver: Silver has completed a three phase rally to resistance and now should drop to a more important low in the 920-30 range.

Google:  Support is at 380 and I think GOOG will soon rally to 410. I expect to see the market reach the 450-500 zone this summer.

Thursday, June 15, 2006

S&P Update


Here is a 15 minute bar chart showing regular hours trading in the September S&P e-mini futures. I commented on this chart this morning.

I thought that the market would react from 1255 to 1244 but it only made it to 1249.50, thus showing even more strength than I had anticipated. It is now approaching the 1266 resistance level. There the move up from 1229 would equal the length of the intial move up of about 37 points in the June contract from the low on May 24 at 1245.75 to the high on May 26 at 1283.50.

My best guess now is that any reaction from 1266 will hold in the 1250-55 zone.

S&P


Here is a 15 minute chart showing regular hours trading in the September S&P e-mini futures. I last commented on this chart here.

The market has reached the intial resistance level at 1255 which I mentioned in this morning's guesstimate. My best guess now is that we will see a reaction down to 1244 or so followed by a rally to 1266. This activity in turn is part of what I think is a bigger rally to 1282.

I think yesterday's 1229 low will hold and that we will see the S&P above 1350 this summer.

Guesstimates on June 15, 8:50 am ET

September S&P Futures: I think the market ended the drop from the May 5 top at 1229 yesterday. Support today is at 1238 and I think the market will rally at least to 1255 today and possibly higher. This in turn should be the first phase of a move to new bull market highs.  

September Bonds: The bonds have nearly reached support at 106-28 but the move down looks like only the first phase of a three phase correction. I expect a rally to 107-20 or so followed by a third phase drop to 106-04. Over the next few weeks the market should reach the 110-111 zone.

September 10 Year Notes: The notes broke well below 105-10 today in what looks like only the first phase of a three phase correction. Support is at 104-30 and a second phase rally should reach 105-16. I expect the third phase low to develop around 104-20. I expect the market to rally over the next few weeks into the 107-108 zone.  

Euro-US Dollar: I still think this market has a good shot at reaching the 126.90 level before it drops to 124.30 which is the next short term downside target. An extended drop which should carry below 116 is underway.  

Dollar-Yen: The yen should hold support around 114.30 and then rally to 117.00 or so. The market is in the early stage of  a move to 130.  

July Crude: The market should reach 66.50 soon. Resistance today is at 70.50.

August Gold: Gold has completed a three phase rally to resistance at 582 and now will probably drop to a more important low in the 530-35 range.

July Silver: Silver has completed a three phase rally to resistance near 1015 and now should drop to a more important low in the 920-30 range. Resistance above the market today is at 1015.

Google:  Support is at 380 and I think GOOG will soon rally to 410. I expect to see the market reach the 450-500 zone this summer.

Wednesday, June 14, 2006

S&P Update


Here is a 15 minute bar chart of the June S&P e-mini futures. I discussed this chart in a post about an hour ago.

Instead of a quick break to 1225 the market held 1232 support a fifth time and then, more importantly, rallied above the last reaction high which stood at 1238.50. This is the most bullish price action in almost a week and I think it means that the 1229 electronic low this morning will hold and that the market is on its way to 1282.

S&P


Here is a 15 minute bar chart of regular hours trading in the June S&P e-mini futures. I last commented on this chart yesterday.

By my count (which includes electronic trading not shown on this chart) the market has staged four big rallies from the 1232 level yet we are down there again now. I think this means that support at 1232 has been exhausted and that the S&P's will now make a quick trip to 1225. I still think a big rally will develop from there, probably to the 1282 level.

Advancing Issues


Here is a daily line chart showing the count of the number of issues traded on the New York Stock Exchange which advance in price each day (black line). The pink line is the 5 day moving average of this number while the red line is the 10 day moving average. I last commented on this chart here.

The most important thing to notice about this chart is that while the market averages have dropped below the lows made on May 24 both the 5 and 10 day moving averages have remained above the lows they established then. This is a classic bullish divergence. I think it is particularly important at this juncture because the drop in the S&P from its May 5 high has equalled the biggest corection of the bull market so far (March-August 2004, about 100 points).

It is also interesting to note that today the daily number is showing (so far) an upward zig-zag, breaking above its last high made on June 9.

All in all I think this indicator now has powerfully bullish implications.

Gold


Here is a highly condensed hourly chart showing pit and electronic trading in August gold since its May top at 739. I last commented on gold here.

I have been expecting the break from the May top to halt, at least for a while, near the 2 1/8 multiple of the 252 low made in 1999. This is the 535 level. This morning gold made it to 546 and I think it started a three phase rally from there to 582 or so. Then I will be expecting a drop to 535 followed by a bigger rally, perhaps of $100 or so.

Silver


Here is a highly condensed hourly chart showing pit and electronic trading in July silver futures during the drop from its May top of 1520. I last commented on this market here.

I have been expecting silver to drop to 935 which is just a tad above 921, the 2 5/8 multiple of its 1991 low at 351. This morning silver got as low as 942. I think we will now see a classic three phase rally to 1015 or so. After that I expect the market to drop to 920. I think the next development in silver will be a big rally of 2 or 3 dollars from the upcoming low.

Guesstimates on June 14, 8:50 am ET

September S&P Futures: The market has reached support at 1232 and I think the next move will be upward to 1282. This in turn should be the first phase of a move to new bull market highs.  

September Bonds: I expect 108-12 resistance to hold. The market should now drop to 106-28. Over the next few weeks the market should reach the 110-111 zone.

September 10 Year Notes: The notes should hold resistance at 106-04 and then drop to support at 105-10. I expect the market to rally over the next few weeks into the 107-108 zone.  

Euro-US Dollar: I still think this market has a good shot at reaching the 126.90 level before it drops to 124.30 which is the next short term downside target. An extended drop which should carry below 116 is underway.  

Dollar-Yen: The yen has nearly reached 115.50 resistance and soon should break to support around the 114.30 level. The market is in the early stage of  a move to 130.  

July Crude: The market should reach 66.50 soon. Resistance today is at 69.25.

August Gold: Gold has nearly reached my 535 target which is the 2 and 1/8 multiple of the 252 low. Resistance above the market is at 582.

July Silver: Silver has nearly reached my 935 target. Resistance above the market today is at 1015.

Google:  Support is at 380 and I think GOOG will soon rally to 410. I expect to see the market reach the 450-500 zone this summer.

Tuesday, June 13, 2006

S&P Update


Here is a 15 minute chart of the September S&P e-mini futures. I last commented on this chart this morning.

The market has spent the entire day so far bouncing off of 1242 support but I think it is about to break lower, this time to 1232. I still think the market will rally to 1282 once 1232 is reached.

S&P


Here is a 15 minute chart of the September S&P e-mini futures. I last commented on this chart here.

In electronic trading before this morning's open the market dropped as low as 1239.50. After the open it then rallied to 1255 but gave up all the gains by dropping again to 1241. The market is now rallying from this higher low at 1241. I think that a move to 1282 has begun.

Guesstimates on June 13, 9:15 am ET

September S&P Futures: The market has reached the 1242 downside target and I think the next move will be upward to 1282. This in turn should be the first phase of a move to new bull market highs.  

September Bonds: I expect 108-12 resistance to hold. The market should now drop to 106-28. Over the next few weeks the market should reach the 110-111 zone.

September 10 Year Notes: The notes should hold resistance at 106-04 and then drop to support at 105-10. I expect the market to rally over the next few weeks into the 107-108 zone.  

Euro-US Dollar: The market should hold temporary support at 125.70 and then rally to 126.90.  After that the next step down should carry to 124.30. An extended drop which should carry below 116 is underway.  

Dollar-Yen: The yen soon should reach the 115.50 level. The market is in the early stage of  a move to 130.  

July Crude: The market should reach 66.50 soon.

August Gold: The next step down should carry to 580. Downside target over the next few weeks remains the 2 and 1/8 multiple of the 252 low which stands around the 535 level.

July Silver: The market has broken below 1070 and is now on its way to the next temporary support around 995. Resistance above the market is at 1095. The 935 level should be reached in a couple of months.

.

Monday, June 12, 2006

S&P Update


Here is a 15 minute bar chart showing regular hours trading in the September S&P e-mini futures.

This morning I thought that the market had made its low at 1256.50 and would commence a rally up to 1282. Instead all that happened was a sideways movement of about 3 hours and then the S&P's broke completely throught the 1250-55 zone, my original target range for a higher low.

I now think that last week's low of 1245.75 will be be broken by a bit and that the market will drop to 1242 or so before beginning a move up to 1282.

S&P


Here is a 15 minute bar chart showing regular hours trading in the September S&P e-mini futures. I last commented on this market here.

In this morning's guesstimate I said that I expected the market to drop into the 1250-55 zone and then rally to 1282. So far this morning the market has dropped as low as 1256.50. I think I see signs that we won't make it even to 1255. So I am now assuming that the low for the day has been made and that the market is headed for 1282.

Bonds


Here is an hourly chart showing regular hours trading in the September T-bond futures. I last commented on this market here.

As you can see the market has been stalling just underneath resistance at 108-12. I think this means that the next swing will be downward to higher support at 106-28. I still believe that the bonds will reach the 110-111 range over the next few weeks.

Yen and Euro


Here are hourly charts of the dollar-yen and euro-dollar currency pairs.

I think that the yen will drop to 113.10 or so before it rallies to 115.60. Similarly, it now looks like the euro-dollar will rally to 126.90 before dropping to 125.00 and lower.

Guesstimates on June 12, 8:50 am ET

September S&P Futures: I think the market will drop today into the 1250-1255 zone. After that a rally to 1282 is likely. In any case the low at 1245.75 should hold and the next big move should carry to new bull market highs.

September Bonds: The market should now drop to 106-28. Over the next few weeks the market should reach the 110-111 zone.

September 10 Year Notes: The notes couldn’t make it all the way to 106-08 and now are headed for support near 105-10. Over the next few weeks I expect the market to rally into the 107-108 zone.  

Euro-US Dollar: The market has reached  support at 125.70 but as yet shows no sign of a rally. Next step down should carry to 124.80. An extended drop which should carry below 116 is underway.  

Dollar-Yen: The yen soon should reach the 115.50 level. The market is in the early stage of  a move to 130.  

July Crude: Resistance today is at 72.50. The market should reach 66.50 soon.

August Gold: The next step down should carry to 594. Downside target over the next few weeks remains the 2 and 1/8 multiple of the 252 low which stands around the 535 level.

July Silver: The market is on its way to 1070. Resistance above the market is at 1145. The 935 level should be reached in a couple of months.

Google: Google is on its way to 410, the next upside resistance. Support now is at 380. I think Google will rally into the 450-500 range this summer.  

Sunday, June 11, 2006

Nattering Nabobs of Negativity


Well, The New York Times is at it again. Above this post you will see the cover of this week's New York Times Magazine. It depicts the debt bogeyman coming to get you. Its colors are the classic colors of fear, red on black. To the left of this post you will also see some artwork which accompanies the cover story. It depicts Uncle Sam as Gulliver being tied down by the Lilliputians with ropes of debt.

What are we to make of this? Well certainly the NYT is continuing its downbeat propaganda compaign that tries to convince its readers that the US economy is in trouble. But my theory of the big media is that they are in the business of telling people what they want to hear. So this story is good evidence that, at least among the elite in the USA, there is a lot of negative sentiment about the US economy and its prospects. As far as I am concerned this means that no significant drop in stock prices is likely for the forseeable future.

I note also that the bogeyman of debt is a contrary opinion signal that the US bond market is headed up from here. And I think it that Gulliver/Uncle Sam is telling us that the US dollar is headed up too.

Friday, June 09, 2006

S&P Update


Here is an updated 15 minute chart of the September S&P e-mini futures. I commented on this chart earlier this morning.

I think the market is about to break below support at yesterday's close of 1266.25. If it does then the next stop will be roughly the 1255 level from which a rally to 1280 should develop.

S&P


Here is a 15 minute bar chart showing regular hours trading in the September S&P e-mini futures. I last commented on this market here.

In this morning's guesstimate I said that I thought the market was stalling in the 1268-70 zone and would drop early today to 1255 or so and then rally. The market's early action has changed my mind about this.

The key fact is that the early break from the 1271 opening price stopped at 1266.75, just above the last tick of yesterday's regular hours trading at 1266.25. I had expected a quick drop to negative territory for the day, but since it hasn't happened I now think that the S&P's will move up to the 1280 level before the first significant reaction occurs.

Guesstimates on June 9, 8:50 am ET

September S&P Futures: The S&P’s appear to be stalling in the 1268-70 zone. I think the market will drop early today to 1255 or so and then finish the day strong. In any case yesterday’s low at 1245.75 should hold and the next big move should carry to new bull market highs.

September Bonds: Bond bounced off of 108-12 resistance yesterday and should now drop to 106-28. Over the next few weeks the market should reach the 110-111 zone.

September 10 Year Notes: The notes couldn’t make it all the way to 106-08 yesterday and now are headed for support near 105-10. Over the next few weeks I expect the market to rally into the 107-108 zone.  

Euro-US Dollar: The market is on its way to 125.70.  Resistance is at 128.10. This should be only the first stage of an extended drop.

Dollar-Yen: Support today is at 113.60 and the yen soon should reach the 115.50 level. The market is in the early stage of  a move to 130.  

July Crude: Resistance today is at 71.20. The market should reach 66.50 soon.

August Gold: The market has reached temporary support near 610 but I think the 624 level is resistance.  The next step down should carry to 594. Downside target over the next few weeks remains the 2 and 1/8 multiple of the 252 low which stands around the 535 level.

July Silver: The market is on its way to 1070. Resistance above the market is at 1145. The 935 level should be reached in a couple of months.

Google: Google is suddenly showing strength in the face of a falling market. I am giving up on my 344 target and am looking for 410 as the next upside resistance. Support now is at 380. I think Google will rally into the 450-500 range this summer.  

Thursday, June 08, 2006

Advancing Issues


Here is a daily line chart recording the number of issues traded on the New York Stock Exchange that advance in price each day. I last commented on this chart here.

Today the major averages made new lows for the drop from the May 5 top. But as you can see on the chart above neither the daily count of advancing issues nor its 5 or 10 day moving averages made new lows today.

This is a bullish divergence and is more evidence that the 1235 level in the cash S&P (1245.75 in the September futures) marked the end of the correction.

Bull Market Boxes in the S&P 500


Here is a weekly chart showing the bull market boxes for the cash S&P 500. I haven't applied my box theory on this blog for quite a while because it is a lot of work preparing the charts. But I think this example nicely illustrates the basic principle. The box size of 185.68 points was defined by the size of the first rally off of the bear market low at 768.63 in October of 2002.

My theory is simply that reactions and rallies during the subsequent bull market tend to begin and end at the box boundaries (which are multiples of 185.68 points up from the 2002 low) as well as at the midpoints of these boxes. Normally bull and bear markets are more likely to end at the midpoint of a box instead of at the top or bottom. This is one reason why I think that the drop from the 1326 high in the cash S&P is corrective and will be followed by new bull market highs.

Note that the midpoint of the current box in the cash S&P is at 1232.75. I think today's low in the cash S&P of 1235.18 ended the reaction from the 1326 level. In any case the next midpoint above the market stands at 1418 and I think there is a good chance that we will see the S&P close to that level later this year.

S&P Update


Blogger has been down all day and I haven't been able to post for several hours until just now.

Here is an updated hourly chart of the September S&P e-mini futures. I last commented on this chart here.

I had been expecting a low near 1241 in the September contract. In the event the market made it down to 1245.75 and has since rallied sharply. I think we have seen the low of the drop from the May 5 top (1342.75 in the September contract). As soon as the market moves above the 1285 level (the last reaction high on the way down to the low) we will have added evidence that the low has been made.

Sometime during the next couple of trading days I would expect to see a reaction down into the 1250-57 range. My best guess right now is that it will start from resistance which I think stands near 1280.

S&P


Here is an hourly chart showing regular hours trading in the September S&P e-mini futures. I am switching into the September contract today and it is trading about 10 points higher than the June contract. I last commented on the June contract here.

Within a day or two the S&P's should hit my 1241 downside target. I think this will end the move down from the 1331 top in the June contract made May 5. The 1241 target would make the entire reaction in the cash market about 95 points in length which equals the length of the March-August 2004 drop, the biggest reaction since the March 2003 low.

Once the upcoming low is in place I expect the market averages to move visibly above their May highs. This up move should take most of the summer.

Guesstimates on June 8, 8:50 am ET

September S&P Futures: Switching to the September contract today; it is trading about 10 points over June. Resistance today is at 1268. The S&P’s are on their way to 1241.

September Bonds: Bond are on the way to 108-12. Over the next few weeks the market should reach the 110-111 zone.

September 10 Year Notes: The notes are on the way to 106-08. Over the next few weeks I expect the market to rally into the 107-108 zone.

Euro-US Dollar: The market is on its way to 125.70. Resistance is at 128.10. This should be only the first stage of an extended drop.

Dollar-Yen: The yen is headed for 115.50. The market is in the early stage of a move to 130.

July Crude: Resistance today is at 70.60. The market should reach 66.50 soon.

August Gold: The market is headed downward to temporary support at 610. Resistance above the market is at 630. Downside target over the next few weeks remains the 2 and 1/8 multiple of the 252 low which stands around the 535 level.

July Silver: The market is on its way to 1070. Resistance above the market is at 1170. The 935 level should be reached in a couple of months.

Google: Google is suddenly showing strength in the face of a falling market. I am giving up on my 344 target and am looking for 410 as the next upside resistance. Support is at 369. I think Google will rally into the 450-500 range this summer.

Wednesday, June 07, 2006

NYSE Group


Here is a chart of the New York Stock Exchange Group. I last commented on NYX here.

I think NYX has made its post-merger low at 55.38 and is now headed to the 1 and 5/8 multiple of that low at 90, just a shade below its all time high so far of 91.35.