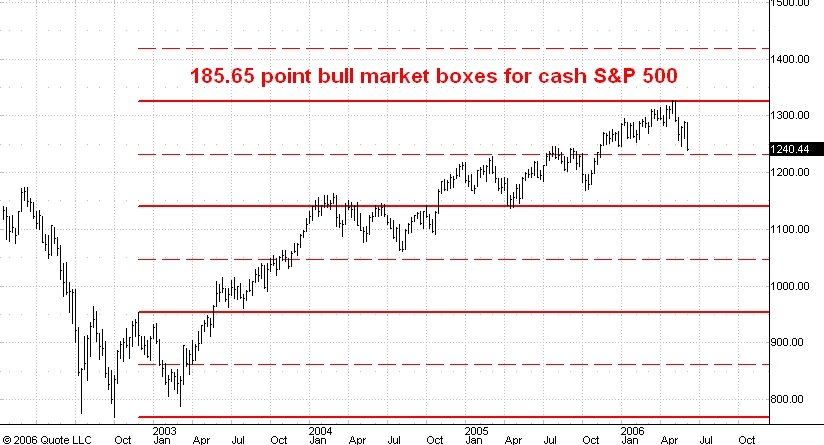
Here is a weekly chart showing the bull market boxes for the cash S&P 500. I haven't applied my box theory on this blog for quite a while because it is a lot of work preparing the charts. But I think this example nicely illustrates the basic principle. The box size of 185.68 points was defined by the size of the first rally off of the bear market low at 768.63 in October of 2002.
My theory is simply that reactions and rallies during the subsequent bull market tend to begin and end at the box boundaries (which are multiples of 185.68 points up from the 2002 low) as well as at the midpoints of these boxes. Normally bull and bear markets are more likely to end at the midpoint of a box instead of at the top or bottom. This is one reason why I think that the drop from the 1326 high in the cash S&P is corrective and will be followed by new bull market highs.
Note that the midpoint of the current box in the cash S&P is at 1232.75. I think today's low in the cash S&P of 1235.18 ended the reaction from the 1326 level. In any case the next midpoint above the market stands at 1418 and I think there is a good chance that we will see the S&P close to that level later this year.
No comments:
Post a Comment