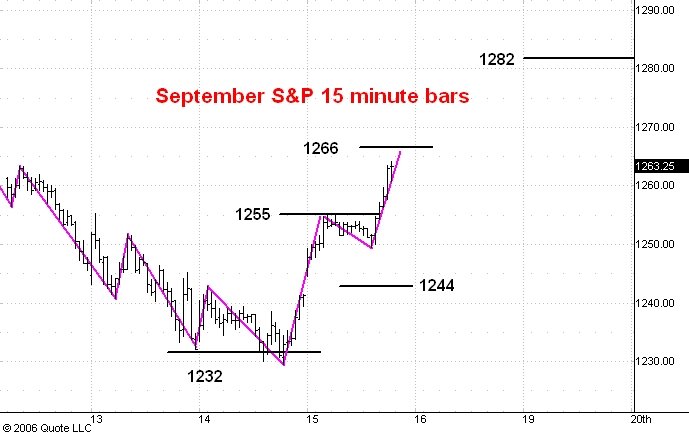
Here is a 15 minute bar chart showing regular hours trading in the September S&P e-mini futures. I commented on this chart this morning.
I thought that the market would react from 1255 to 1244 but it only made it to 1249.50, thus showing even more strength than I had anticipated. It is now approaching the 1266 resistance level. There the move up from 1229 would equal the length of the intial move up of about 37 points in the June contract from the low on May 24 at 1245.75 to the high on May 26 at 1283.50.
My best guess now is that any reaction from 1266 will hold in the 1250-55 zone.
No comments:
Post a Comment