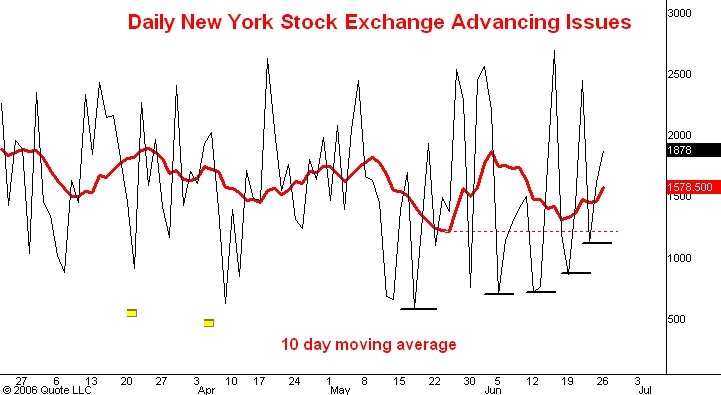
Here is a line chart showing the daily count of the number of issues traded on the New York Stock Exchange which advance in price. The red line is the 10 day moving average of this number. I last commented on this indicator here.
The S&P's are very quiet today (so far) and are trading roughly in the middle of last week's range. This sort of situation does not arise too frequently, but when it does it is generally wise to follow the market's direction as soon as it shows obvious movement on increasing trading volume with expanding ranges.
Right now I think it is reasonable to expect the movement out of this narrow range to be upward. The chart above shows one reason why.
Note that the low on June 14 at 1229 in the futures occurred with the 10 day moving average visibly above the low it had made in May. Moreover, you can see the sequence of higher lows made by the daily numbers. These are all signs that the selling squall has abated and that the technical condition of the market is strengthening. I note also that today, despite the narrow range, more than 50% of the issues traded so far are trading above Friday's close, another sign of a strengthening market.
I think the S&P's are headed for 1282 and that the market will reach the 1350 level this summer.
No comments:
Post a Comment