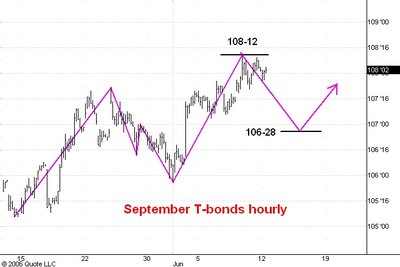
Here is an hourly chart showing regular hours trading in the September T-bond futures. I last commented on this market here.
As you can see the market has been stalling just underneath resistance at 108-12. I think this means that the next swing will be downward to higher support at 106-28. I still believe that the bonds will reach the 110-111 range over the next few weeks.
No comments:
Post a Comment