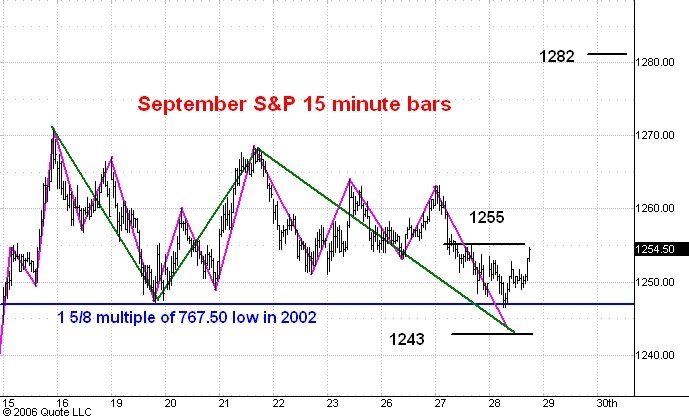
Here is a 15 minute bar chart showing regular hours trading in the September S&P e-mini futures. I commented on this chart yesterday afternoon.
You can see that the market dropped as low as 1246.50 today, taking just a peek below the 1247.25 low made on June 19. I was looking for a drop into the 1240-43 range but the market didn't follow through on the downside breakout.
A failure to follow through on an obvious breakout is usually a warning that a trend in the opposite direction is about to begin.
In the current situation I am inclined to take this warning seriously for several reasons. First, I think this market has a lot of bullish potential. Second, by taking a peek below the 1247.25 level the drop from the 1270.75 high on June 15 now looks like a three stage correction. Third, the advancing issues number today is higher than yesterday's despite the new correction low for the market and this was true even when the 1246.50 level was hit. This emphasizes the bullish divergence I discussed earlier this week.
All in all I think the evidence now points to an imminent move to 1282 and eventually higher than that. A break above the 1255 resistance level will be a late confirmation of this view.
No comments:
Post a Comment