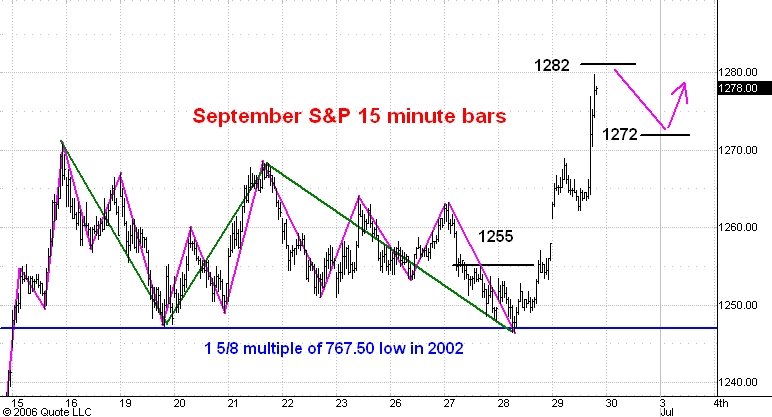
Here is a 15 minute bar chart showing regular hours trading in the September S&P e-mini futures. I commented on this chart yesterday afternoon.
The market has nearly reached the 1282 resistance level. I don't think we shall see much of a reaction from that level. I estimate support at 1272, a shade above the 1270.75 top made on June 15.
I think the market is in the early stage of an advance from the June 14 low of 1229 which will take it to 1350 this summer.
1 comment:
Great analysis. Information I really trade with. You're not perfect but no one is. And you are no bullshit
Post a Comment