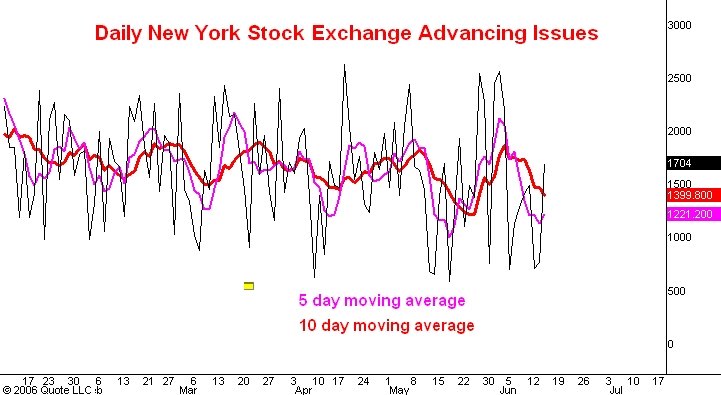
Here is a daily line chart showing the count of the number of issues traded on the New York Stock Exchange which advance in price each day (black line). The pink line is the 5 day moving average of this number while the red line is the 10 day moving average. I last commented on this chart here.
The most important thing to notice about this chart is that while the market averages have dropped below the lows made on May 24 both the 5 and 10 day moving averages have remained above the lows they established then. This is a classic bullish divergence. I think it is particularly important at this juncture because the drop in the S&P from its May 5 high has equalled the biggest corection of the bull market so far (March-August 2004, about 100 points).
It is also interesting to note that today the daily number is showing (so far) an upward zig-zag, breaking above its last high made on June 9.
All in all I think this indicator now has powerfully bullish implications.
No comments:
Post a Comment