 I keep hearing that there is too much bullish sentiment around about the stock market and that this means that a subtantial drop lies dead ahead. Let me explain why I think this is nonsense.
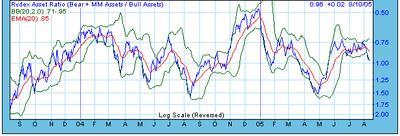
Here is a chart of what I call the "Rydex Ratio". It comes courtesy of Decisionpoint.com. (You have to be a subscriber to access this data, but I think the $20 monthly subscription fee is well worth it!)
This number is the ratio of money flows into Rydex bull funds to money flows into both Rydex bear funds and Rydex bull funds. Note that the scale on the chart is reversed. Low values indicate bullish public sentiment but show high up on the chart while high values indicate bearish sentiment but show at low levels on the chart.
The important thing to me is that this number measures what amateur speculators are acutally doing in the stock market as opposed to what they or their advisors are saying. Talk is cheap and actions speak much louder than words!
You can see that during the rally from the April lows this ratio showed gradually increasing bullish sentiment but it never got near the level associated with the March 2005 top or the March 2004 top in the S&P 500. Moroever, during the past two months the ratio has shown increasing bearish public sentiment as the S&P has steadily but slowly crept higher.
I think that before the S&P 500 can drop even as much as 5% this ratio will first have to move down below 0.70 (i.e. the line on the chart will have to move upward!).
The Rydex ratio reinforces my conviction that there is too much bearish sentiment out there to allow a stock market top of any importance at current levels.
Update on August 24: Sorry to say, I posted the wrong chart above this post. Take a look at this post on August 24 to see the correct chart and my updated view on the situation.
No comments:
Post a Comment