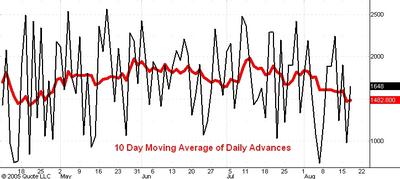

The only oscillator I follow and one that I have used for almost 40 years is the moving average of the number of daily advancing issues on the New York Stock Exchange.
Above this post you see two daily charts. On each chart the black line records the daily number of advancing issues. The red line on the first chart shows the 10 day moving average of the number of daily advances. The red line on the second chart shows the 5 day moving average of this number.
Notice first that the 10 day moving average is lower than at any time since the 1136 low in mid-April. Yet the S&P is only 25 points off of its high. I would expect a much bigger break to be assoicated with this oscillator level so this is a bullish piece of evidence. Next notice that yesterday the market established the low point of its reaction thus far, but the daily number (the black line) made a higher low relative to its 738 reading on August 5. Finally, observe that the 5 day moving average had already turned upward and did not "confirm" the new low for the reaction that was established yesterday.
Given that the market has only dropped a bit below the bottom of its box at 1224 I have to regard the oscillator evidence as definitely bullish and supporting my view that the market is headed for 1268 soon.
No comments:
Post a Comment