Here is a five minute bar chart showing regular hours trading in the June S&P e-mini futures. I last commented on the S&P's here.
As I said in this morning's guesstimate the odds are that the market will take a peek below the 1268.25 low made after yesterday's close. But I think the market will hold above 1260 and then rally above 1290. This would be consistent with a very conservative interpretation the the 5 day moving average of the daily count of the number of advancing issues on the NYSE.
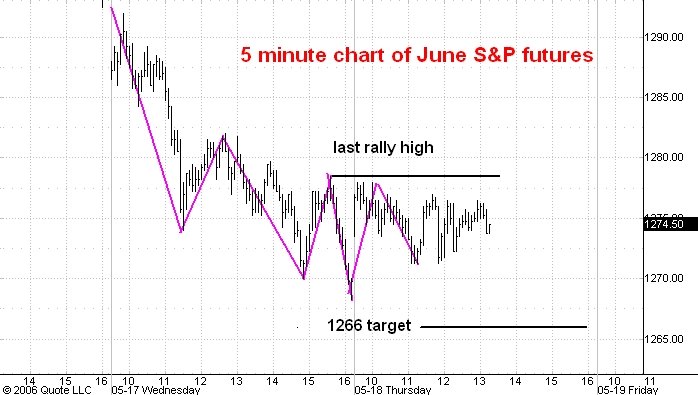
On the chart above I have drawn a horizontal line at the level of the last rally high on the way down to the 1268.25 low. A move above this line would be evidence that the 1268.25 low started a 25-30 point rally, especially if the breakout occurs on high volume. I think this is less likely then a quick visit below 1268.25 but it is important to be prepared for eventualities.
No comments:
Post a Comment