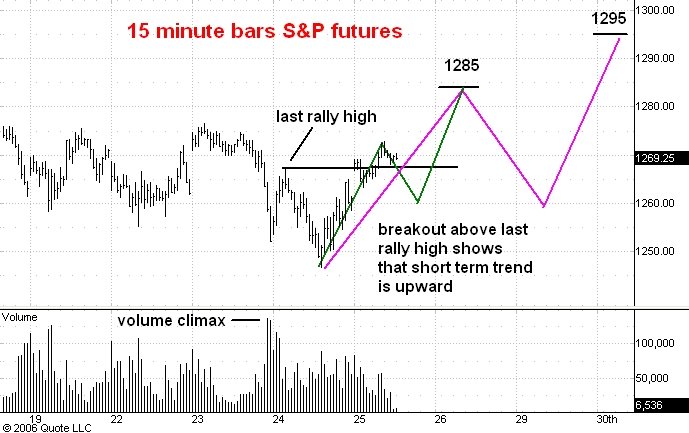
Here is a 15 minute bar chart showing regular hours trading in the June S&P e-mini futures. I last commented on this chart here.
As you can see the market has definitely broken above the last rally high which was established just prior to yesterday's 1246.75 low. I think this means that the market is headed for 1285 in a classic three phase advance (pictured in green on the chart). In turn the move to 1285 will probably be only the first phase of a bigger advance to 1295 with the second phase dropping the market to1260 or a bit lower. After the 1295 level is reached (probably 10 days from now) I will be expecting a move down into the 1230-40 zone to complete the entire correction from the May 5 top at 1331.
No comments:
Post a Comment