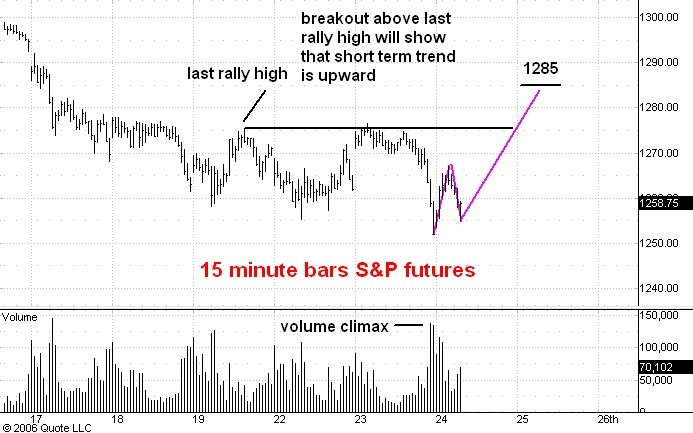
Here is a 15 minute bar chart showing regular hours trading in the June S&P e-mini futures. I last commented on this chart here.
I think the market has just completed a reaction to a low above yesterday afternoon's electronic low at 1246.25 (not shown on the chart). The subsequent rally should carry above yesterday's high and this will confirm the start of a bigger three phase rally. The first phase of this rally should carrry to 1285.
No comments:
Post a Comment