
Here is a pair of charts which gives some perpective on the current position of the S&P 500 index.
The first chart above this post is a weekly chart of the cash S&P. It shows the last three substantial corrections within the current bull market. The first occurred from March through August of 2004 and carried the index down 102 points. The next two occurred during 2005 and carried the index down 93 and 78 points respectively.
The recent high was at the 1326 level. A drop of 78 points from there would end at 1248. A drop of 93 points would end at 1233. A drop of 102 points would end at 1224.
Thus far the index has dropped as low as 1256 and on this basis I think it fair to conclude that the correction that started from 1326 is much closer to its end than to its beginning.
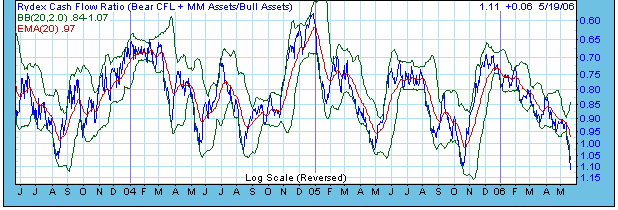
The second chart above this post shows the Rydex cash flow ratio. This ratio is calculated and maintained by Decisionpoint.com and you have to pay $20 per month to access their site. (I for one think it is well worth the price.) I have discussed this ratio often on this blog, most recently here, here, and here.
A high value of the ratio tells us that short term traders are moving money out of stocks and into money market funds and funds which bet on declining stock prices. The scale on the chart you see is an inverted one so that high values of the ratio show up low on the chart.
Last Friday the daily value of the ratio reached its highest level of the past 6 years at 1.11. This shows that short term traders are very bearish and agressively betting on further drops from here. I think this is a very bullish situation.
The only thing that prevents me from looking for a move straight to 1350 from current levels is that the drop from 1326 does not yet show a clear three phase structure. So for the moment I expect a rally to a lower top and then a drop to a slightly lower low, probably near 1233 or 1224 in the cash index. Futures traders should remember that by the time this low develops (probably next month) the front contract will be the September contract. This contract will probably be trading about 10 points over cash at the low so the futures low will be more like 1243 or 1234.
No comments:
Post a Comment