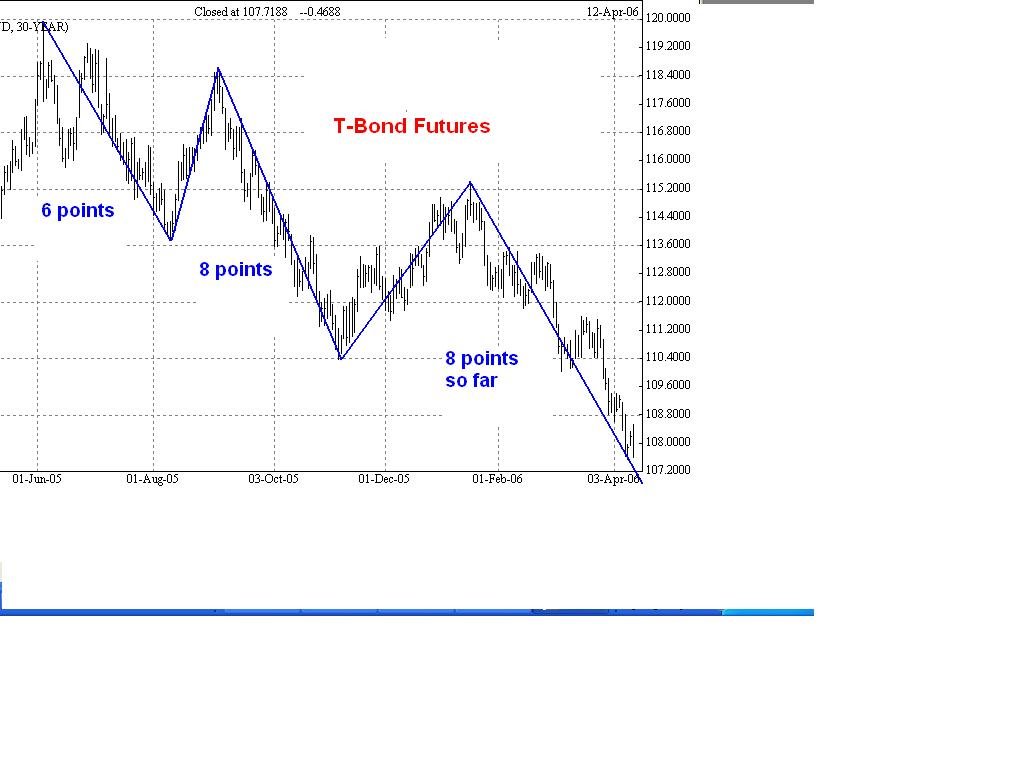
Here is a daily continuation chart of the T-bond futures going back to the June 2005 high at 119-23.
I think the market is getting close to the point where a rally of 5 points or so is likely to develop.
My reasoning is simple. There have been three important downswings within the drop from 119-23. The first one carried down about 6 points and was followed by a 5 point rally. The second carried the market down about 8 points and then was followed by another 5 point rally. At the 107-05 level the June '06 bond futures were 8 points below their January '06 top of 115-05. The market is now at a juncture where any technical evidence that the drop from 115-05 is ending will also imply a move up into the 111-112 range.
No comments:
Post a Comment