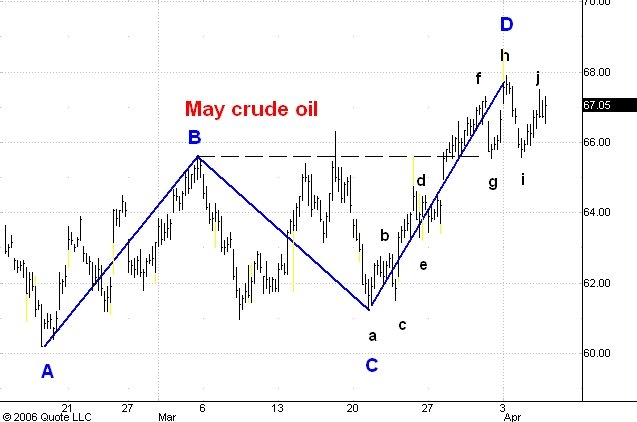
Here is an hourly chart of pit trading in May crude oil futures.
I think a three phase rally ended at blue point D. The fact that the reaction from black f to g was bigger than any in the upswing from blue point C was a warning that the swing from C was ending. More evidence along these lines came when the drop from black h to i was bigger than the drop from f to g.
I expect the market to trade below 67.00 early in tomorrow's pit session and if it does this will be an indication that it will soon break the lows g and i. A break below this support would in turn mean that the market is headed below 60.00.
1 comment:
Carl, could you explain what is three phase rally? thanks
Post a Comment