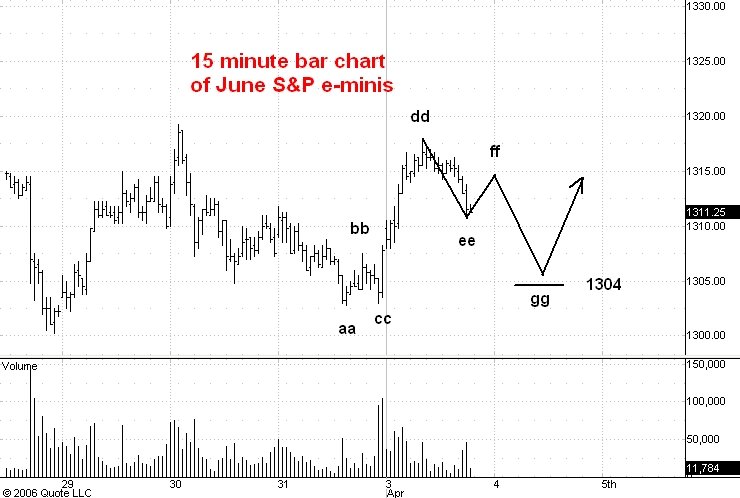
Here is a 15 minute bar chart of the June S&P e-mini futures.
I thought the market was on a breakout move this morning but action since then contradicts this view. Note how the move down from point dd has started to get steeper along with an increase in volume. The drop from dd is already visibly bigger in price and time that the preceeding reaction from bb to cc. Moreover, a break that starts from the top of a trading range almost always ends near the bottom of the range instead of in the middle.
This makes me think we are headed back to the low of the trading range with support centered at 1304. The drop should assume the classic three phase look by the time it is complete.
No comments:
Post a Comment