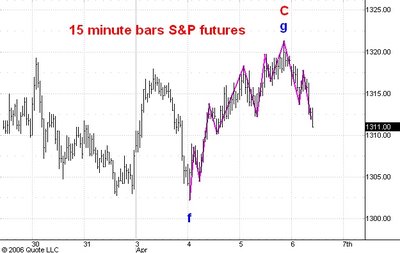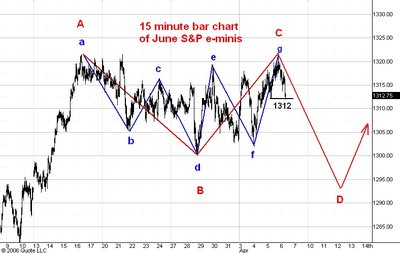

Here are two charts showing trading in the June S&P e-mini futures. They are both 15 minute bar charts but the first one is highly condensed while the second shows more detail.
This morning's weakness portends a move to lower price levels, probably down to 1293. Look at the second chart above this post. I have drawn the swings up from blue point f in purple. You can see that the sequences of higher lows has been ended and a sequence of lower lows has begun. The drop from yesterday's high has been the biggest reaction in the swing up from blue point f and has violated the low at 1312.25 of the second biggest reaction. Since downtrends within a trading range rarely end in the middle of the range it looks to me like the market is headed down at least below 1305.
But on the condensed chart you can see that the whole sideways move from red point A now looks like two complete phases of the three phase correction, with each of the first two phases themselves having three phases. This makes me think that the market is headed down to 1293.
I still think we will see the futures at 1328 and then at 1350 after this correction is complete.
No comments:
Post a Comment