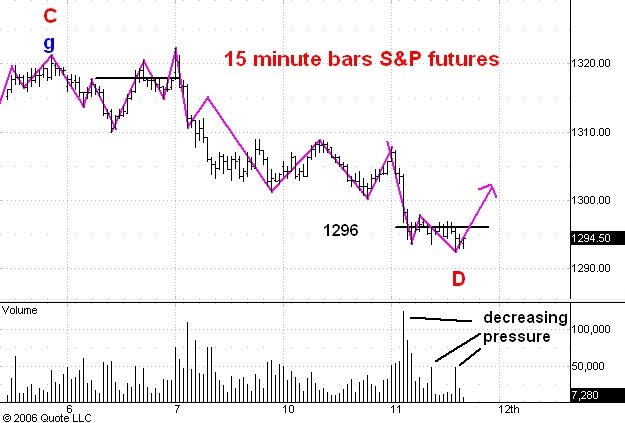
Here is a 15 minute bar chart showing regular hours trading in the June S&P e-mini futures. I commented on this chart earlier today.
Looking at the volume line beneath this chart I conclude that the selling pressure on the market has been easing. Since the downswings have been shortening too and since we are still near support around 1296 I conclude that the drop from red point C is probably complete. I shall be convinced of this once the market rallies back above the 1300 level.
The next big move from here will be to 1330 and higher.
No comments:
Post a Comment