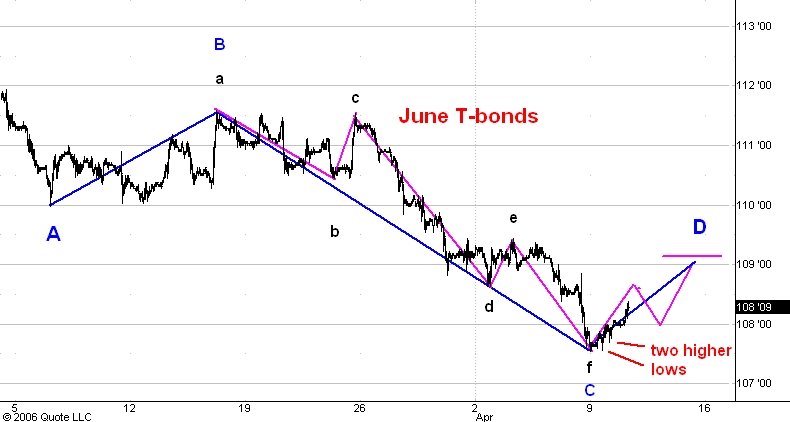
Here is a highly condensed hourly chart showing pit and electronic trading in the June T-bond futures.
I think the swing down from blue points B to C is complete and that the market is staging a classic three phase advance to 109-04. At that price the projected rally C to D will equal the last rally from A to B.
Note that the advance from black point f has already exceeded the length of the rally from d to e. Moreover the swing down from e to f was shorter than the swing down from c to d. This together with the fact that the market put in two consecutive higher lows on the hourly chart after the low at 107-17 is evidence in favor of a rally to 109-04.
No comments:
Post a Comment