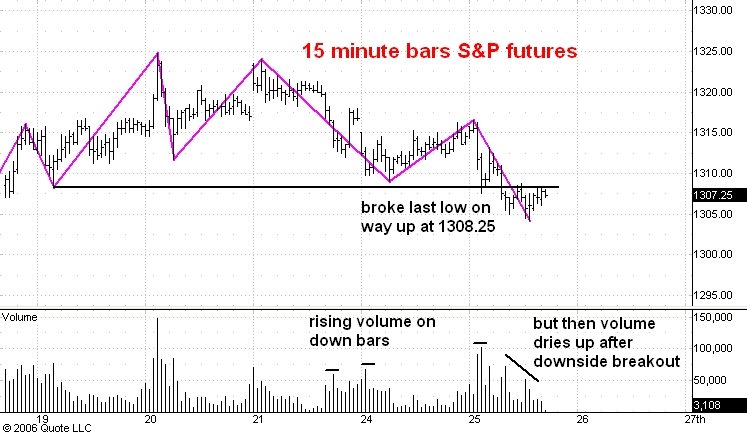
Here is a 15 minute bar chart showing regular hours trading in the June S&P e-mini futures.
Yesterday afternoon I pointed out that the market was acting as if the low at 1309 would hold. This morning a very strong consumer sentiment number convinced the market (at least temporarily) that the Fed would continue its program of raising interest rates. The subsequent break took out the 1308.25 level which was the last low on the way up to the 1324 top.
As I watched this sequence of events unfold this morning I thought it likely that the market would continue down to support at the 1288 level. The pace of the downswing was faster than the preceeding downswing. Moreover, the volume showed a definite tendency to increase on down bars. Finally, the drop from 1324 no longer had the appearance of a three phase correction.
But after the market broke below 1308.25 there was little downside follow through. And as you can see volume dried up. I had been expecting a wide open break after the breakout and whenver the market fails to follow through after such a breakout I become suspicious.
Right now I am using the 1308.25 level as my indicator. Strength above there later today, especially a close back above that level, will make me believe that the breakout was really a shakeout and that tomorrow will start a rally to 1330 and above. Failing this show of strength I will have to assume that the next stop is 1288.
No comments:
Post a Comment