
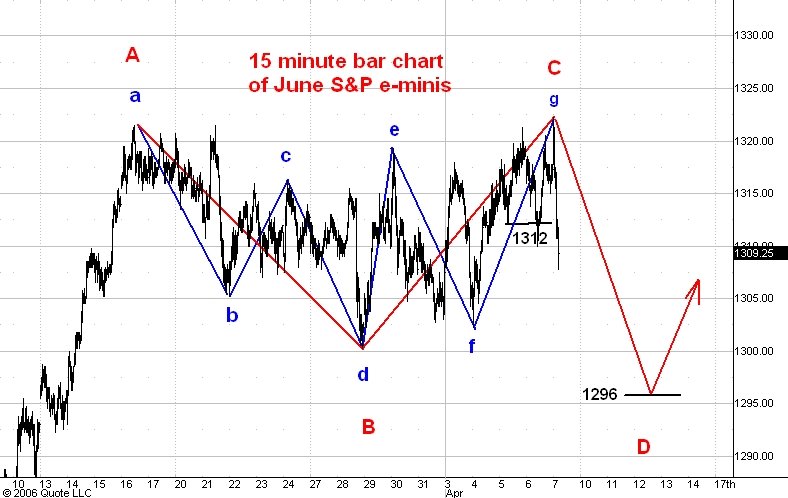
Here is a pair of 15 minute bar charts showing regular hours trading in the June S&P E-mini futures. I commented on these charts yesterday here and here.
I thought the market would break out above the 1321 level and would subsequently hold the 1315 level but very aggressive selling developed after the breakout as you can see. Note the high volume bar in the middle of the 1300-1324 trading range visible in the second chart above this post. This together with the break below 1315 and the fact that markets rarely stop in the middle of a trading range tells me that we are headed for 1296.
The first chart above this post shows my interpretation of the price action since the March 16 high, point A on the chart. I think the move down from this morning's high at 1324 begins the third an final phase (red C-D) of the correction. Ultimately I think the market will drop to 1296 or so and then move up to 1350.
1 comment:
I hope that people have tight stops in place otherwise your SP calls are a bit off target. But nevertheless all in all one of the better blogs.
Post a Comment