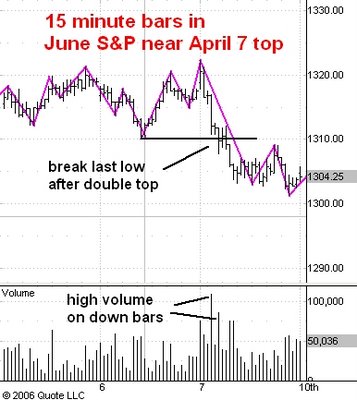

One useful trick for interpreting the significance of market action is to compare similar situations. The two 15 minute bar charts you see above show the action in the June S&P e-mini futures during regular trading hours. The first depicts the activity on April 7 at the top of 1324 (reached overnight and not shown on the chart). The second chart depicts activity today with the day's high so far of 1324.75.
On April 7 you can see that the market dropped right from the open after the 1324 high reached after the employment number that day. The highest volume of the day came on subsequent down bars. Moreover, this volume was associated with a break of the last low on the way up to 1324.
Today traders evidently believed that a sure profit could be had by selling a new high and looking for a repeat of the April 7 action (which evenutally was followed by a drop all the way to 1286.50). But notice the difference between the two days. First of all the volume on the break today was lower than the volume of the climax bar at the high today. This contrasts with the high and increasing volume seen on down bars after the high on April 7. Secondly, the break today has so far held support at the last low on the way up, the 1308.25 level.
This comparison makes me think that the market is showing stronger action today than it did on April 7. And I think the result will be that the 1308.25 support level will hold and that we shall soon see the futures trading above 1330.
No comments:
Post a Comment