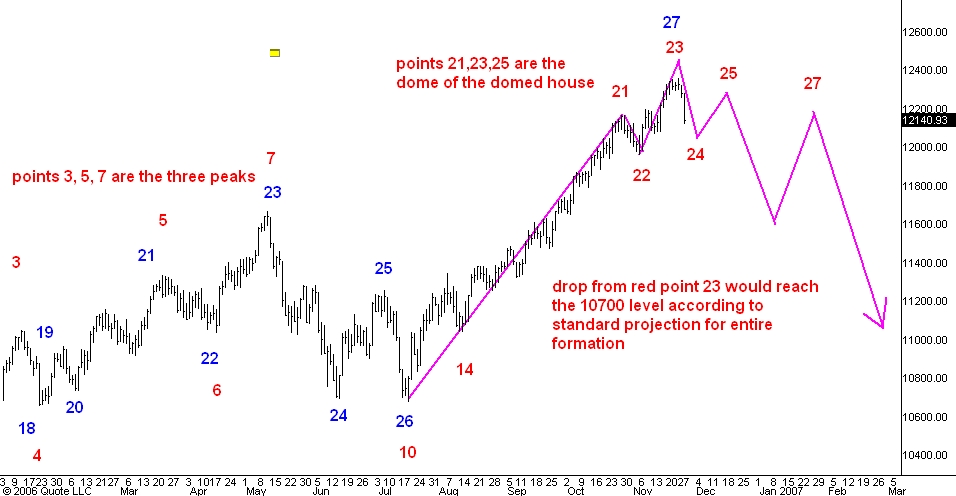
Here is a daily bar chart showing the current position of the Dow industrials within an example of a minor three peaks and a domed house pattern (red numerals). I last discussed this pattern here.
The market has put in a top as projected for late November. The issue now is whether or not it is the peak of the domed house as depicted above or whether it is just point 17 as illustrated in the schematic shown in my last post on this subject.
Right now I am leaning towards the point 17 interpretation instead of the labeling you see above as point 23. I have three reasons.
First, this very fast break only the second day off of the top is characteristic of a bull market reaction, not the start of a downleg in a bear market. Secondly, I note that neither the 5 nor the 10 day moving averages of the daily count of the number of issues advancing showed any substantial bearish divergence at last week's high. Finally, I still think that short term market timers are prepared to turn bearish at the drop of a hat instead of buying reactions.
All these factors make me think that this break will only last 4-6 trading days and end above point 22. If this happens I will relabel the recent high point as red point 17, the subsequent low point 18 and expect the domed house (points 21-23-25 ) to form during the first quarter of 2007.
If the market instead takes out red point 22 on the chart above I will have to accept the recent high as point 23 and start looking for a substantial drop during the first half of 2007.
1 comment:
Excellent analysis. That's how I'm seeing the market right now too, ie. preparing for a transition, rather than poising for an immediate drop.
Post a Comment