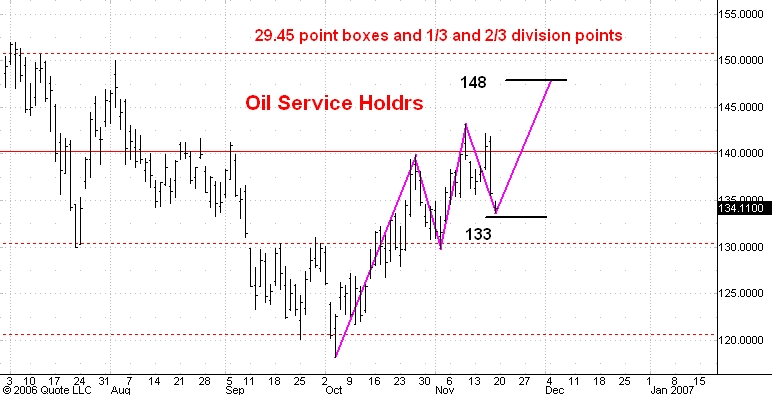
Here is a daily bar chart of Oil Service HOLDRS. I last commented on this ETF here.
I think the market is completing the third and last phase of a three phase decline from 143. At the133 level the drop would equal the size of the previous reaction from 139 to 129. So I think 133 is support and that the next development will be a rally to 148.
No comments:
Post a Comment