

I have been following the development of two concurrent examples of George Linday's Three Peaks and a Domed House formation in the Dow Industrials. You can find my most recent post on this subject here. And here is the link to all of my George Lindsay posts.
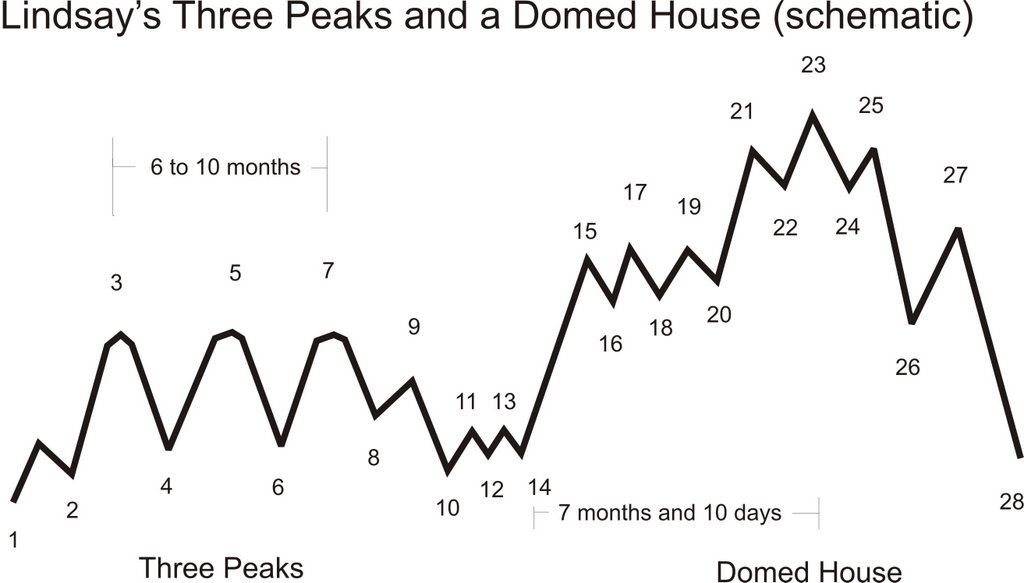
The first chart above this post is a highly condensed daily bar chart which shows both these Three Peaks and a Domed house formations. The blue numbering identifies the turning points of the major formation. These numbers correspond to the turning points in the schematic of the ideal formation which you can see above this post. The blue numbered formation is a major one because the time from peak 3 to peak 7 is at least 6 months.
The second chart above this post is a close-up look at the second example of the Three Peaks and a Domed House formation. The turning points of this formation are identified by the red numbers. This is a minor formation because peaks 3 and 7 are separated by fewer than 6 months.
At this juncture I have more confidence in the minor formation with the red numbering than in the major formation. There are two reasons.
First, in the major (blue) formation, point 27 exceeds point 23. This is very unusual, although I had predicted that blue point 27 would indeed exceed blue point 23. Also, blue point 6 is below blue point 10. This is an allowed departure from the schematic but more often one finds point 1o below point 6. These two departures from the schematic reduce my confidence in the blue formation.
My second reason is that the major formation predicts a drop to Dow 9800 over the next 6 months or so. It is my view that such a drop would amount to more than 20% from the upcoming high. I happen to believe that most market participants are ready to turn bearish at the drop of a hat and that consequently there is little chance that the next drop will exceed 15%.
On the other hand the red formation predicts that the drop from red point 23 will only carrry the Dow down to 10600 or so. I find this a more plausible target.
As I have noted on the chart I think that we have seen point 21 in the red formation and that the rally to the peak of the domed house at point 23 is underway. I think this top will develop near Dow 12500. The 7 month 10 day time span counted from red point 6 predicts that point 23 will develop on November 27.
There is one fly in this ointment. So far I see no convincing evidence of points 15-20 in the red formation. There have been important formations in the past that did not show any obvious points 15-20. But I also think that the "momentum peak" for the rally from the July 2006 low (red point 10) was reached in late October. Generally speaking such momentum peaks can easily preceed the price top by two or three months. So there is ample room for more upside activity into December or even January. The bottom line is that red point 21 on the chart may in fact only be red point 15. If so I would have to count 7 months and 10 days from either red point 10 or red point 14. This then would imply a price peak at red point 23 on February 28 or March 21 in 2007.
It doesn't really matter that much whether or not point 23 occurs on November 27 or instead on February 28 or March 21 of next year. I think any price gains between November 27 and March 21 will be limited in comparison to the gains from red point 10 through the end of November. So in any case it makes sense to adopt a less bullish posture by the end of the month and expect the next break to last several months and carry the market down to its July 2006 low near 10600.
1 comment:
Your analysis is quite interesting and I think it is a quite realistic view.
In fact, as I see this market quite strong actually I am puzzled.
On one hand I do not understand how a significant slowdown of the economy could not impact the stock market. Lower interest rates would not manage to sustain corporate profits. On the other hand shorting such a strong market as it is today could also be painful. At the moment I can only see some bearish patterns develop on specific stocks, but general market condistions so far are good.
Given that the market has been extending already for quite a long time together with the developing fundamentals of the economy, I think that a prolonged correction is serious possibility.
Post a Comment