Here is an hourly chart of December T-bond futures. I last commented on this market here.
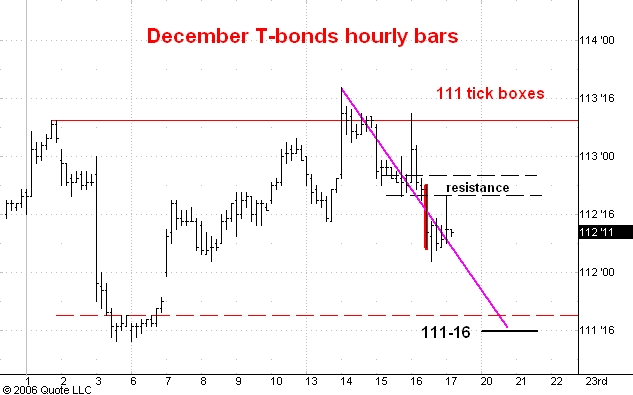
I have shown the current resistance zone on the chart. It ranges from 112-21, the level of the daytime low on Wednesday, to 112-16, the point at which a rally from 112-03 would equal the 23 tick rally that ended at yesterday's high.
I think the bonds are headed down to the low of the current trading range and the 1/2 point of the current box near 111-16.
No comments:
Post a Comment