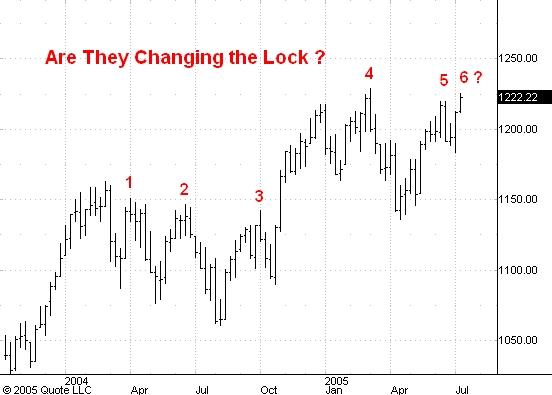
The weekly chart you see above shows fluctuations of the S&P 500 cash index over the past 18 months. Traders have made quite a good living during that time selling every time the average approaches its previous high. These instances are labeled 1 through 5 on the chart. The only loss this tactic would have incurred was on the post-election rally in November 2004.
Now we are at point 6 and sellers have gotten aggressive once more as the market approaches its March high of 1229.11. Are they going to get lucky a sixth time (out of seven) ?
I don't think so! I think the market is changing the lock on the cash box and the sellers will soon be in for a surprise.
No comments:
Post a Comment